
OpenCTI Performance and Tuning Observations.

As many know, I have been running a public instance of OpenCTI for the last few months. During this time I have been constantly upgrading the OpenCTI as new releases come out, experiment with things and load test. Meanwhile updating the howto article, and the docker-compose and .env variables as necessary. The majority of this article will focus on Performance/Load Testing part of that.
In my case, I am currently running on a 12 Vcpu, 64GB VM running Ubuntu Server 22.04, with Nvme PCIe4 SSD storage. I am currently in the process of building a dedicated server for this project, with a 14th gen i9-14900k, 128GB of DDR5 6000mhz RAM, and Enterprise Nvme PCIe x 5 storage, which I will be migrating to in a few weeks. So look for an update to this article once I throw the fastest hardware I can at the platform. 😎
We will see how much raw CPU power and cores will help processing, or not. Not to mention blazing fast disk I/O and memory speed. That being said, the way I have the platform configured, I have ALL RULES enabled, and many connectors constantly enriching and fetching new data, just to set the stage of what I am dealing with here. Not only that, I have custom Wazuh and TheHive Integrations checking hash's and IP/domains from Wazuh agents Sysmon events continually to see if there is an indicator in the database. The worst case in terms of load and stressing the platform.
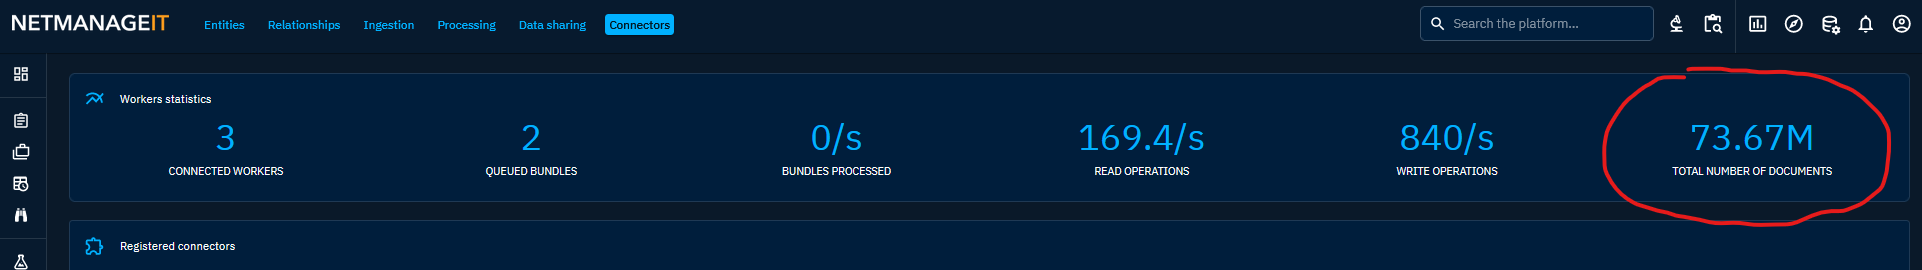
As the system now has over 73 Million Documents, 1.38M Entities, 2.16 Million Relationships, and 1.47 Million Observables. I started to get severe lag at times, spotty performance issues, front end crashes and other behavior. So I have been playing with a variety of settings, restarting the stack, and watching memory and monitoring metrics to see the result in the real world. So I wanted to share some of the things I did to "tune" or improve the performance.

Most people, will not have anywhere near this amount of data, but like I said, part of my goal is to see how far I can push the platform, and what hardware is needed to make it run acceptable when dealing with this amount of data. Below will be some of the things I have done to make the platform run well with this amount of processing and data. Throwing all the hardware in the world at it, will not fix the issue, unless you dial in the docker variables and or settings in various parts of the Server/Stack.
First off, let me say on the subject of the amount of workers you set. 3 is the default, some may be tempted to increase this to say 10, or even 20. Without scaling the other parts of the system, Redis, Elastic, RabbitMQ, you will quickly run into a log jam and experience severe performance issues. So number 1 rule with OpenCTI, less is more, when it comes to workers. OpenCTI will tell you this themselves, and have stated so multiple times. The best practice to scale is setup multiple servers in a cluster. If after you make changes to increase the performance of Elastic, Redis etc. Then you can start slowly increasing the worker count and monitor the performance. Then you have me over here trying to see just how far you can take a single-node deployment. 😀
In my case, even after optimizing a lot of stuff, I still found the recommended default of "3" workers, OpenCTI's official recommendation per server, a good place to land. This slows down the constant sheer amount of work/processing of enrichment and ingestion, but in a way it spreads it out over a longer period of time/duration. If the workers are set to high, and the hardware/stack isn't optimized. The platform might run good periodically, but when AlienVault or AbuseIPDB starts fetching bundles and processing/enriching the data, the platform will come to a crawl and timeout etc. This is even more true, when you have all rules enabled, like I do, as they are constantly running and enriching data 24/7 in the background.
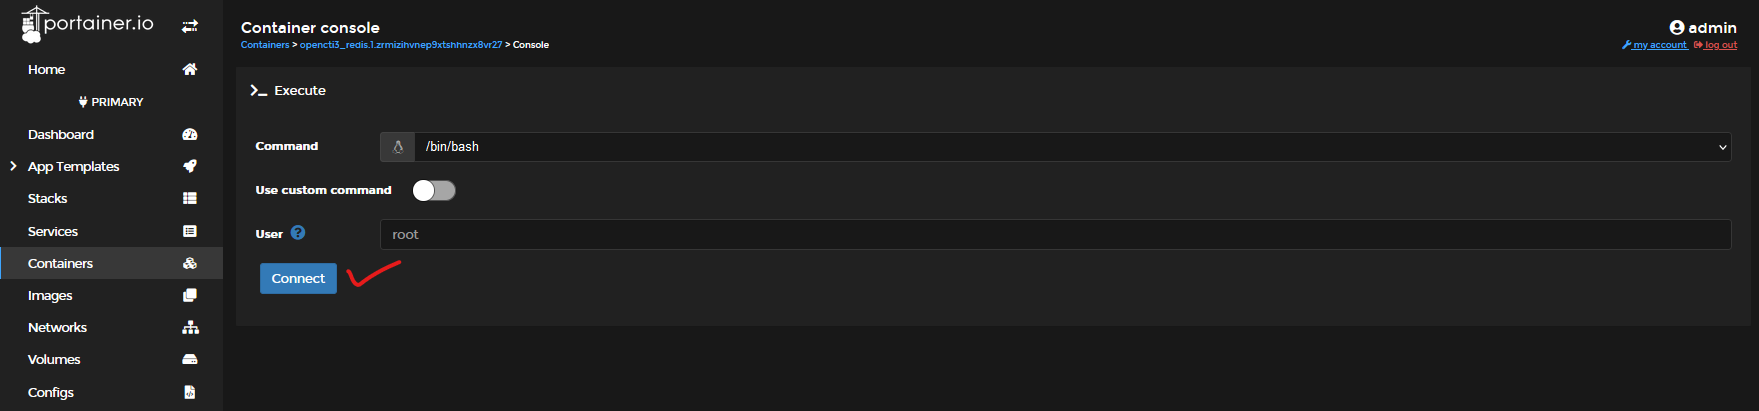
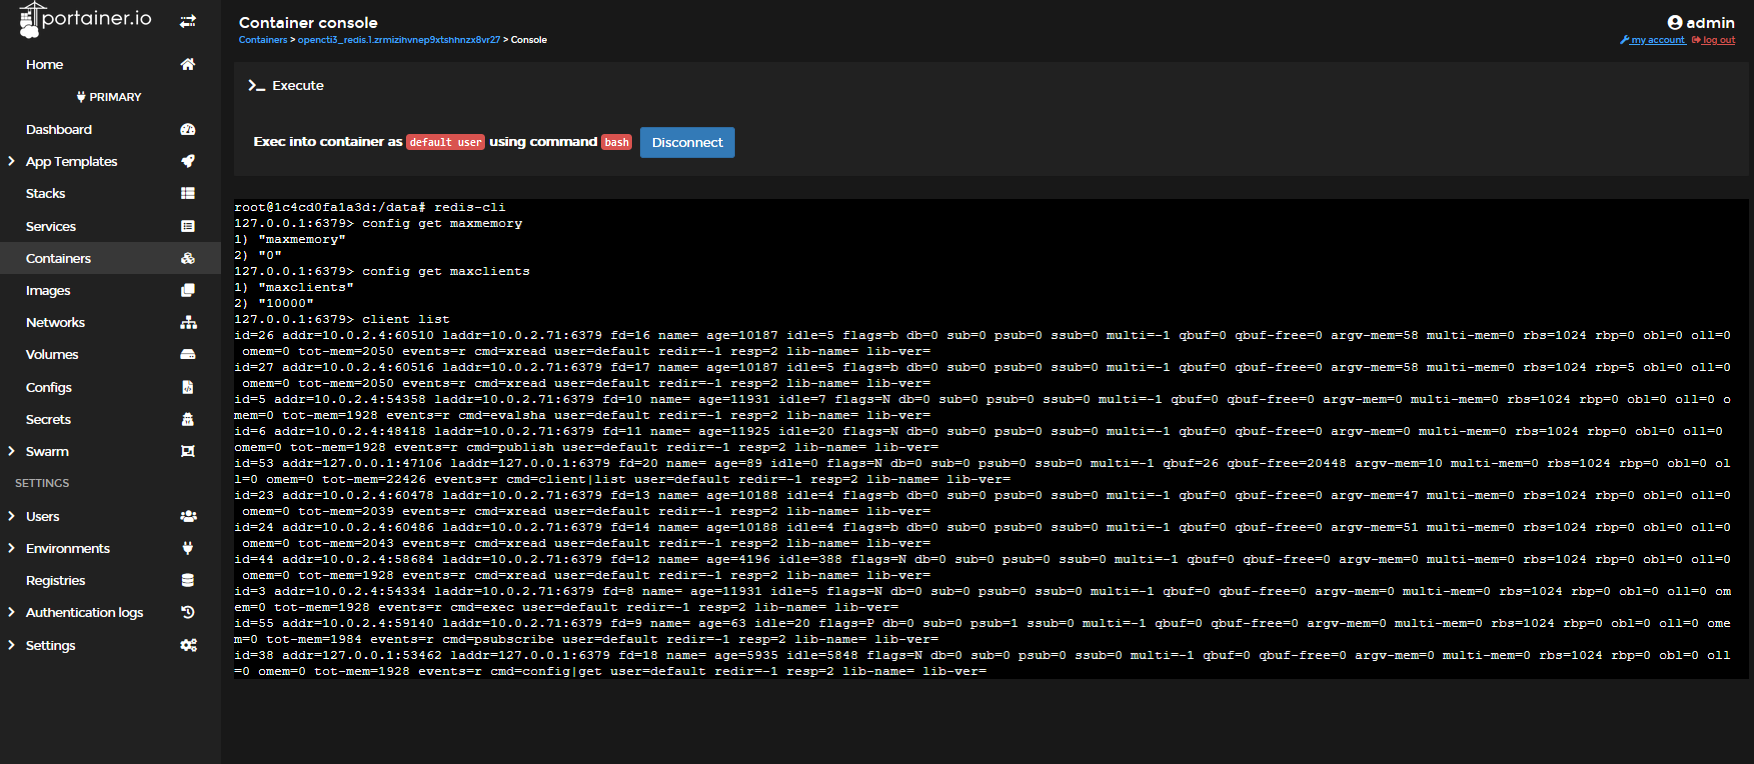
Lastly, I would highly recommend looking at each individual container logs, and or if necessary execute the shell to get inside the running container to run commands to gather more data or temporarily change settings.
Note: A lot of the command line changes, will be temporary and will be reset on stack/server reboot. To keep things persistent, most of the time a proper docker-compose setting will need to be specified, so it can tell the container to override the default config file settings of each container when the stack starts.
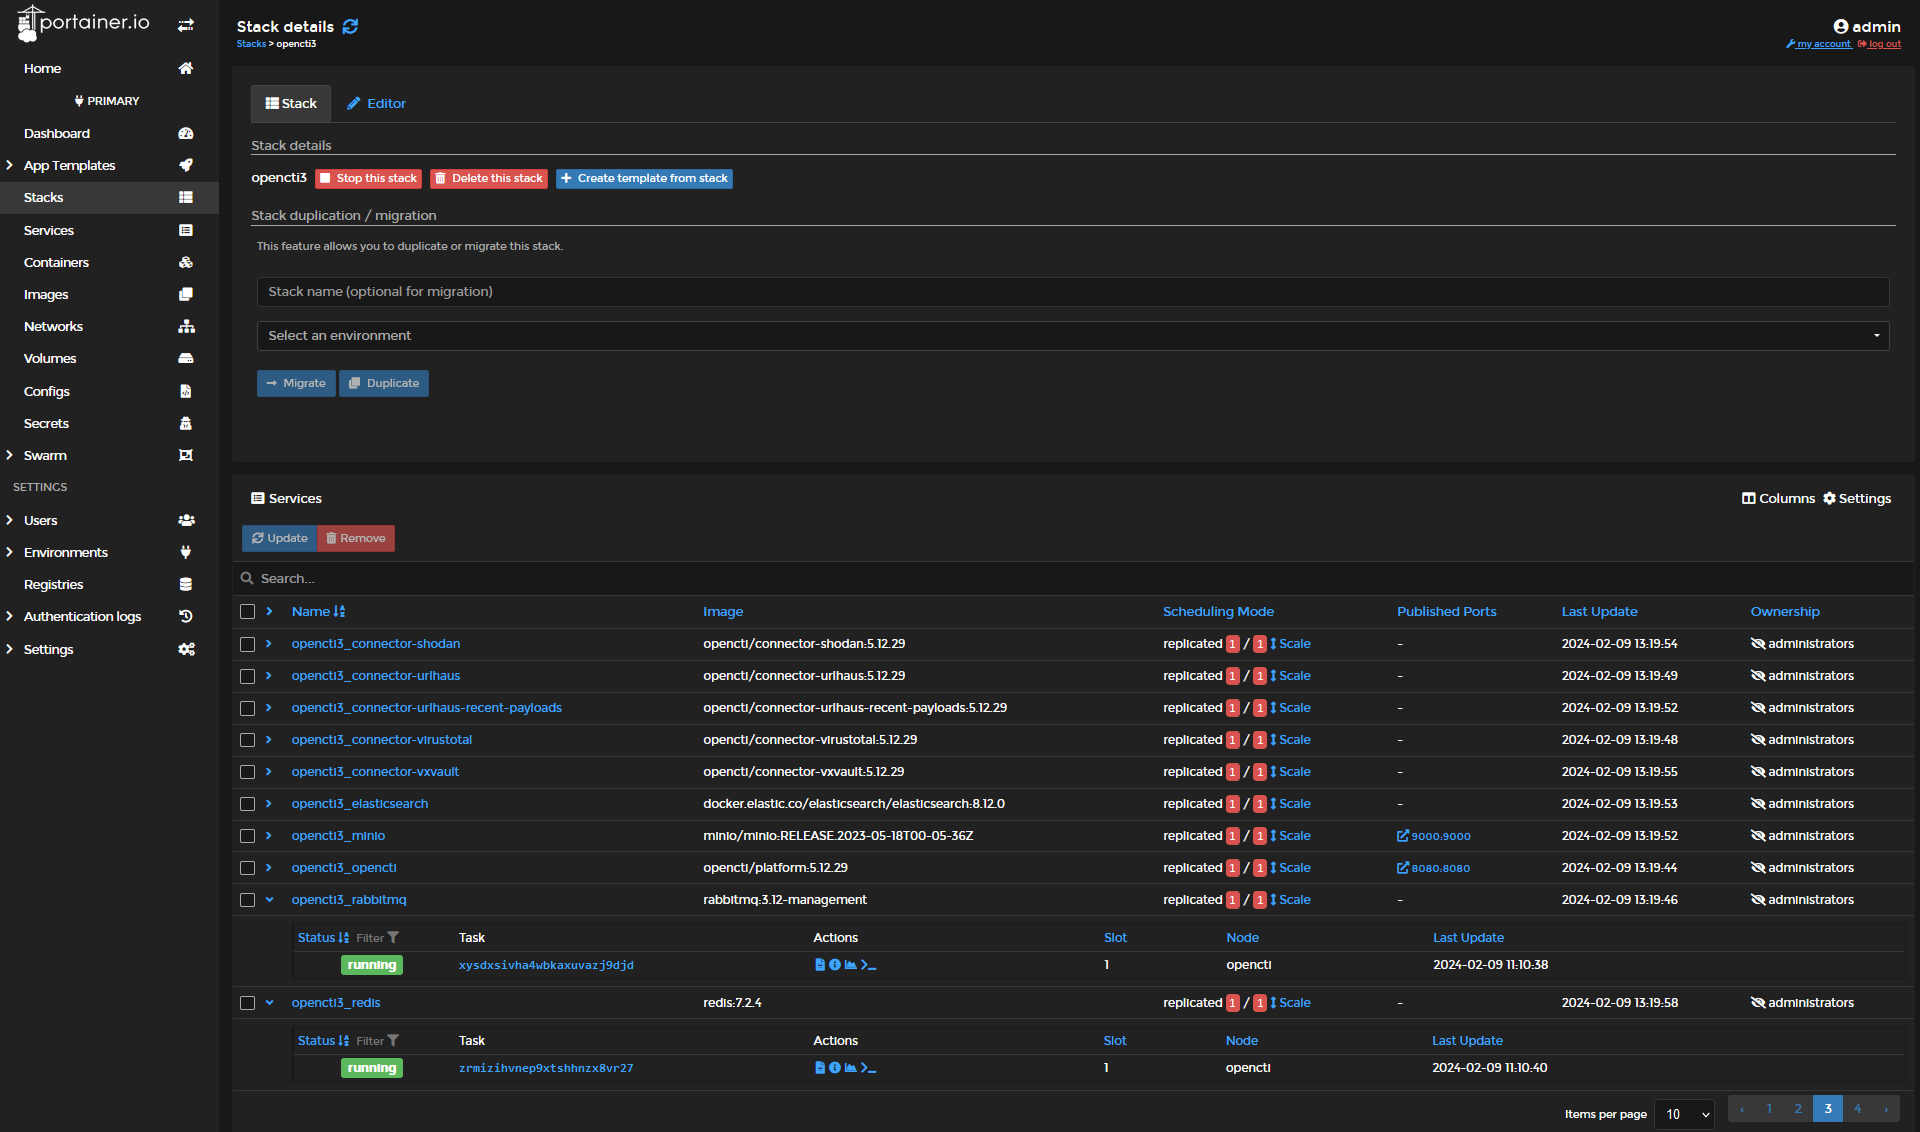
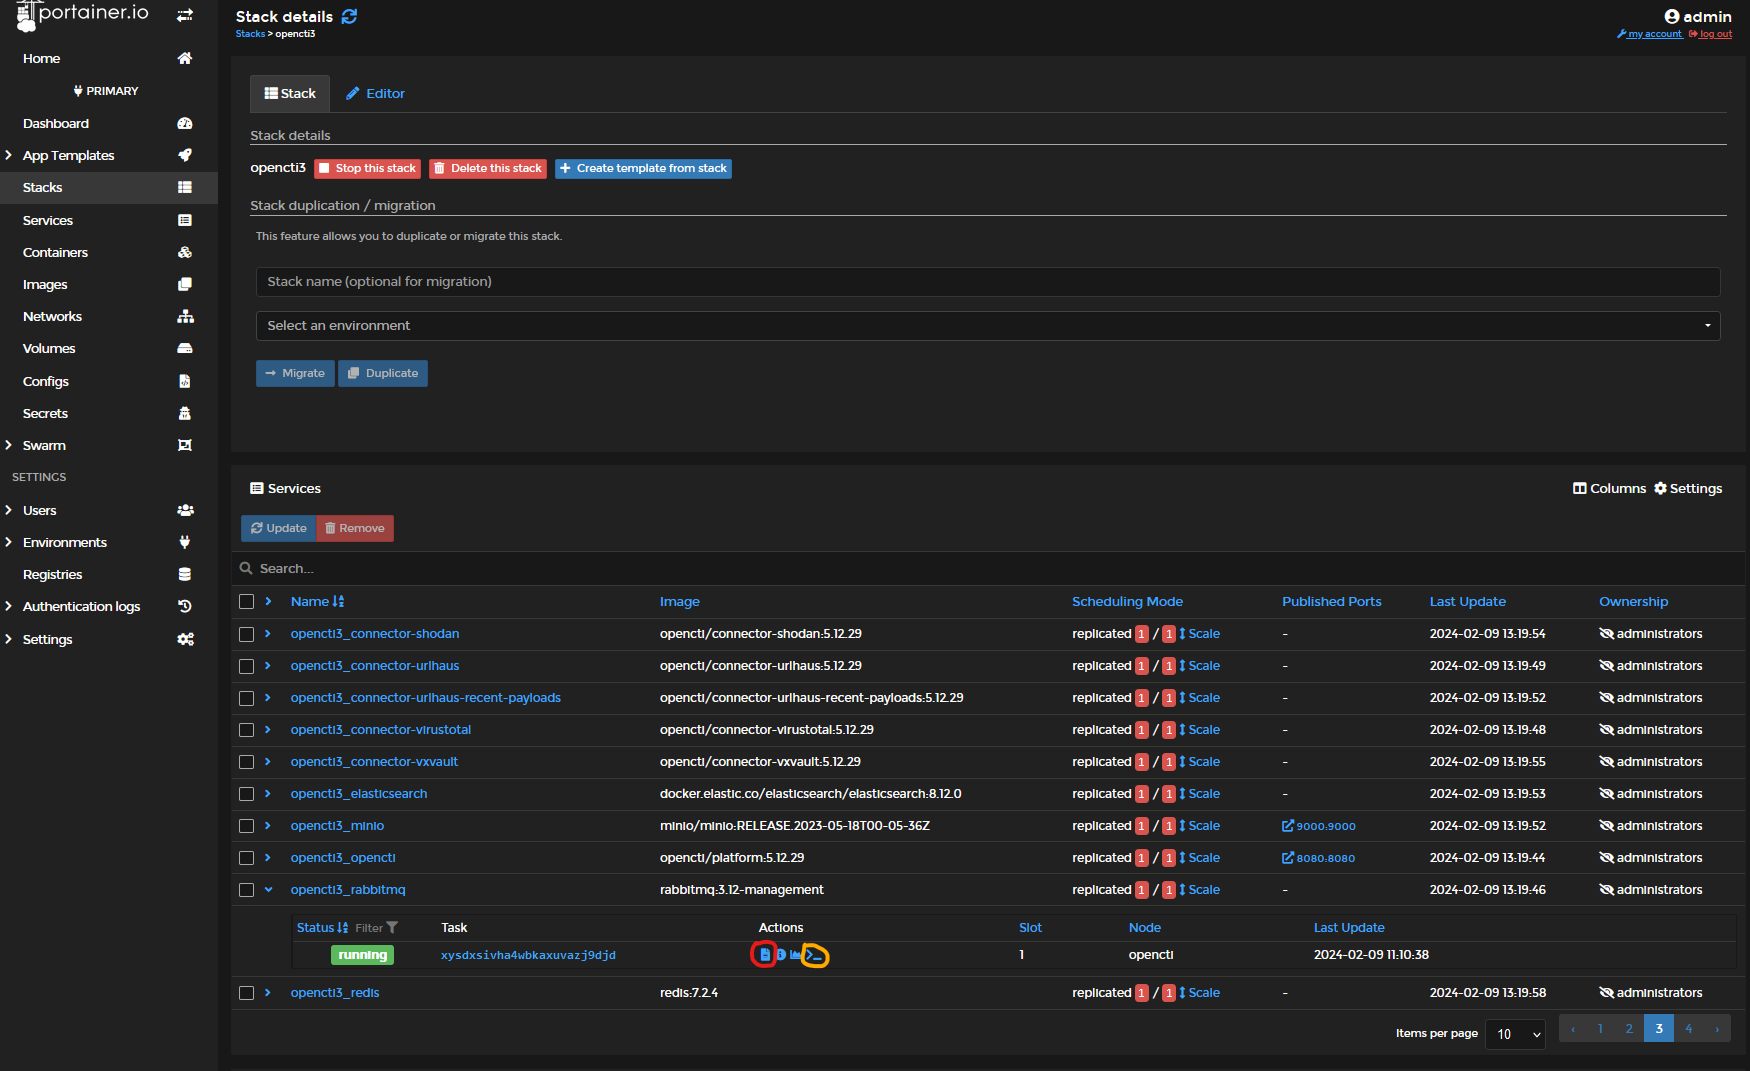
For those who have followed my Portainer OpenCTI install howto, this couldn't be any easier. See below where to view live logs, Download archival log files, and start the docker exec bash shell for each container. By expanding the services and viewing containers, you will see little icons. Red circle = Logs icon , Orange circle = Start Shell icon.
By watching the live log entries roll in for containers, while using the platform, or by downloading the complete log file, you can see warnings and errors and correlate to the live performance. Review these log entries, and google these errors to get additional knowledge and options to try. There is plenty of advise on how to tune or improve/eliminate these errors online.
My Settings I have settled on for now
First, I found Elastic was warning on having too low of a vm Map count, and it stated right in the logs what it should be changed to. This wasn't there initially, but as the database and ingestion rate grew, it started showing up. If you see this error, you need to execute the command on the host system:
"sysctl vm.max_map_count=262144". To make this persistent after restart, you need to edit the sysctl.conf file.
"sudo nano /etc/sysctl.conf" then add "vm.max_map_count=262144" at the end of the file and save.
This seemed to help Elastic deal with large amounts of data sets, searching and index speed. The warning in the Elastic logs also went away, which acknowledges the change was received by the Elastic Container.
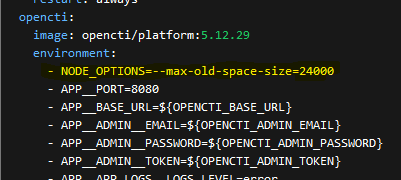
Next settings I changed, where my Node Java Memory setting. In the docker-compose you will see the following lines. The default is "8096" MB, in my case I changed it to 24000 MB. This raises the memory ceiling for the main Java Node core component.
Building on this, note that the most recent versions of OpenCTI's docker-compose added a few settings to the Elastic settings section that were not there before. The new entries I highlighted are in yellow. Take note, if your running a beefy large OpenCTI instance, make sure this is in the compose file! I will tell you why in a second.
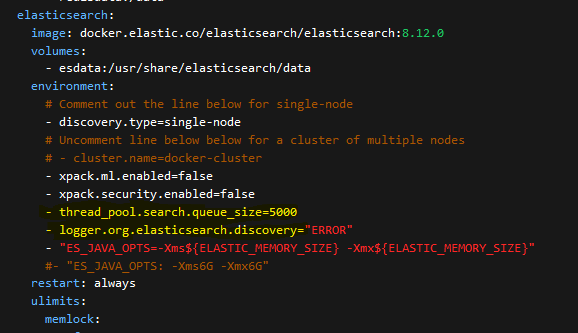
I was experiencing an issue where when a lot of ingestion of bundles and processing was happening. I would try to view knowledge or search, create/exports with a lot of database queries / activity was taking place. When you click on certain areas of the UI, like Knowledge to view the graphical STIX graphs, you would get the dreaded RED error message in the upper left, and to contact admin OpenCTI support.
This stopped occurring once the "thread search queue" setting was added. It must of raised the default search buffer setting for Elastic. So to be able to handle all that data processing so that the system could ingest/process while I used the system by doing extensive searches and reports etc.
Elastic Memory ENV setting...
This I changed from the stock 4GB to 24G for obvious reasons with the amount of data our platform is dealing with.
Redis__Trimming ENV variable.
OpenCTI default is 2,000,000 if no ENV variable is specified. I played around with a variety of settings, and I eventually settled at the default of 2,000,000. Just seems like the sweet spot, but you can play with other options if you are have limited resources. You can experiment with either 500,000, 1,000,000 or 1,500,000 setting options, or leaving the default 2,000,000 setting.

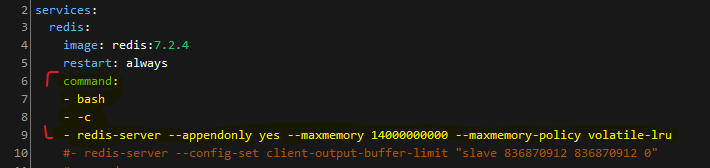
Second thing with REDIS is I played with alternating between a command in my docker-compose to set AOF append, max memory policy, and cycled back and forth between that override and the default OpenCTI unrestricted default REDIS memory settings without AOF.
It does appear. at least when dealing with large amounts of data, REDIS tends to puke on itself, and the UI will crash every so often. By setting the Docker-Compose lines as following, really does seem to prevent REDIS from having a bad day.
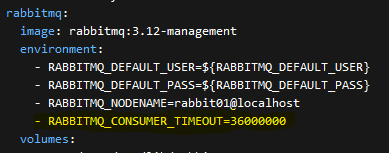
Finally, one more tip/change I added to my custom docker-compose file was to add a timeout setting to RABBITMQ. If you are constantly updating the stack, playing around with things, it is likely, old containers and queues will be orphaned and for a variety of other reasons, you might be seeing a ton of RED errors cycling through the live logs of the RabbitMQ container.
It will say something to the effect in RED "Closing AMQP connections ASAP, channel 0". After researching for a while, I added the following line to the compose to help the loaded system to eliminate these errors. Note: it might take a little bit for stuck connectors, bundles, or some time to pass for the system to stop popping these errors. I have found the problem did not come back, even with constantly meddling with the platform as I do.
Remember these important key points.
Review the logs before, during and after making one change to a variable or setting. Making too many changes at once, and you will be hard pressed to know which tweak made the impact your looking for. Then monitor improvements or degradation on platform speed, ingestion metrics, and general usability.
Depending on your data ingestion amount, total connectors and settings, Relationship Rules enabled, and the hardware you are running OpenCTI on, this will be a dynamic thing and different for each person. In my case, I am aiming to push the system to the max, with the max amount of connectors in use, the max number of rules, and enrichment processes.
That's it for now, don't be afraid to meddle and change things to see what best works for your setup. Eventually, you will find the sweet spot to get the most performance out of your setup, and eliminate any obvious bottlenecks that occur in different parts of the stack.
As always, you can play around or do research on our public platform, where now there is quite a bit of enrichment of the data we are holding in our database!
God Bless
Dan