
NGINX Monitoring with Grafana, Prometheus and Telegraf HowTo

Some users may be looking for a cheap free alternative to monitoring basic NGINX stats for multiple sites, without having to get a paid expensive solution like Datadog, LogicMonitor or other APM tools. Or perhaps even going the official method using something like NGINX amplify or Nginx Plus etc, Amplify is a free SaaS based option offered by F5 which is free for up to 5 Servers.
This solution, is quick and easy, and uses a small footprint and there is no limit to the number of NGINX sites you can monitor. This tutorial will consist of setting up the server side components, Grafana and Prometheus on a Ubuntu 22.04/24.04 VM or any Linux VM of your choice. Hardware requirements are small, 2 vcpu, 4GB and 100GB disk VM will do just fine.
To get started I will be using a non docker native bare metal install of these components. I have found this install to work great, and tested it myself, and works flawlessly. It's also easier to modify prometheus config and grafana configurations than when you use a dockerized version. Rather than reinvent the wheel, go to the link below and follow it all the way to where you complete the prometheus datasource setup with the screenshots, then continue on below.
Setup and Configure NGINX Stubs module and Telegraf on the endpoints to be monitored
Once you have completed the core install above, I will show you my custom setup method for installing and configuring telegraf on your NGINX servers / endpoints and enabling and configuring the NGINX Stubs module on a seperate site/port and limiting access to just the Monitoring Server we setup. Once we do this on one or more endpoints, we will move on to the prometheus.yml configuration and the Grafana prebuilt dashboard setup for NGINX monitoring.
Enable NGINX Stubs module
Go to /etc/nginx/sites-available and create a new site, lets call it "nginxstubs.conf"
Now paste this text into the file editor and save it. Note : change the allow directive to whitelist IP/subnet of your choice and deny the rest. This will protect the /nginx_status site on port 81 from being accessed by the public.
server {
	listen 81 default_server;
	listen [::]:81 default_server;

	root /var/www/html;
	index index.html index.htm index.nginx-debian.html;

	server_name _;

	location / {
		try_files $uri $uri/ =404;
	}

	location /nginx_status {
        	stub_status;
        	allow 127.0.0.1;
        	allow 192.168.0.0/24;
        	deny all;
        }
}
NGINX Stubs Sites-available Configuration
Next, lets enable the site
Now restart NGINX
Install and Configure Telegraf
If your using most flavors of Debian/Ubuntu you can simple use the apt-get install command to install Telegraf.
If you get the message it cannot find the package for that particular distro or version use the script/command below to completely get and install it from official repo.
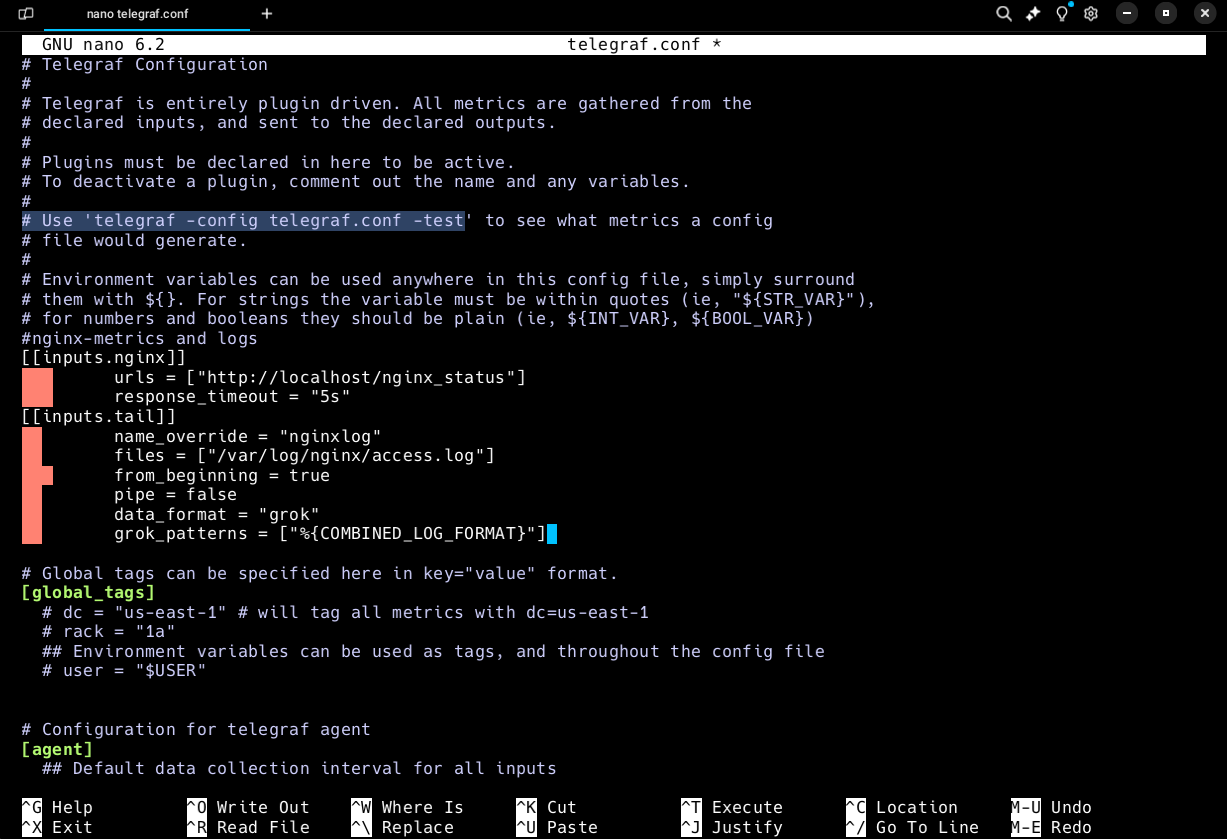
Once installed nagivate to the /etc/telegraf directory and edit the telegraf.conf file to add config code and enable prometheus monitoring.
Past the following Code block at the top of the file
#nginx-metrics and logs
[[inputs.nginx]]
   	 urls = ["http://localhost/nginx_status"]
   	 response_timeout = "5s"
[[inputs.tail]]
  	 name_override = "nginxlog"
  	 files = ["/var/log/nginx/access.log"]
   	 from_beginning = true
  	 pipe = false
  	 data_format = "grok"
  	 grok_patterns = ["%{COMBINED_LOG_FORMAT}"]
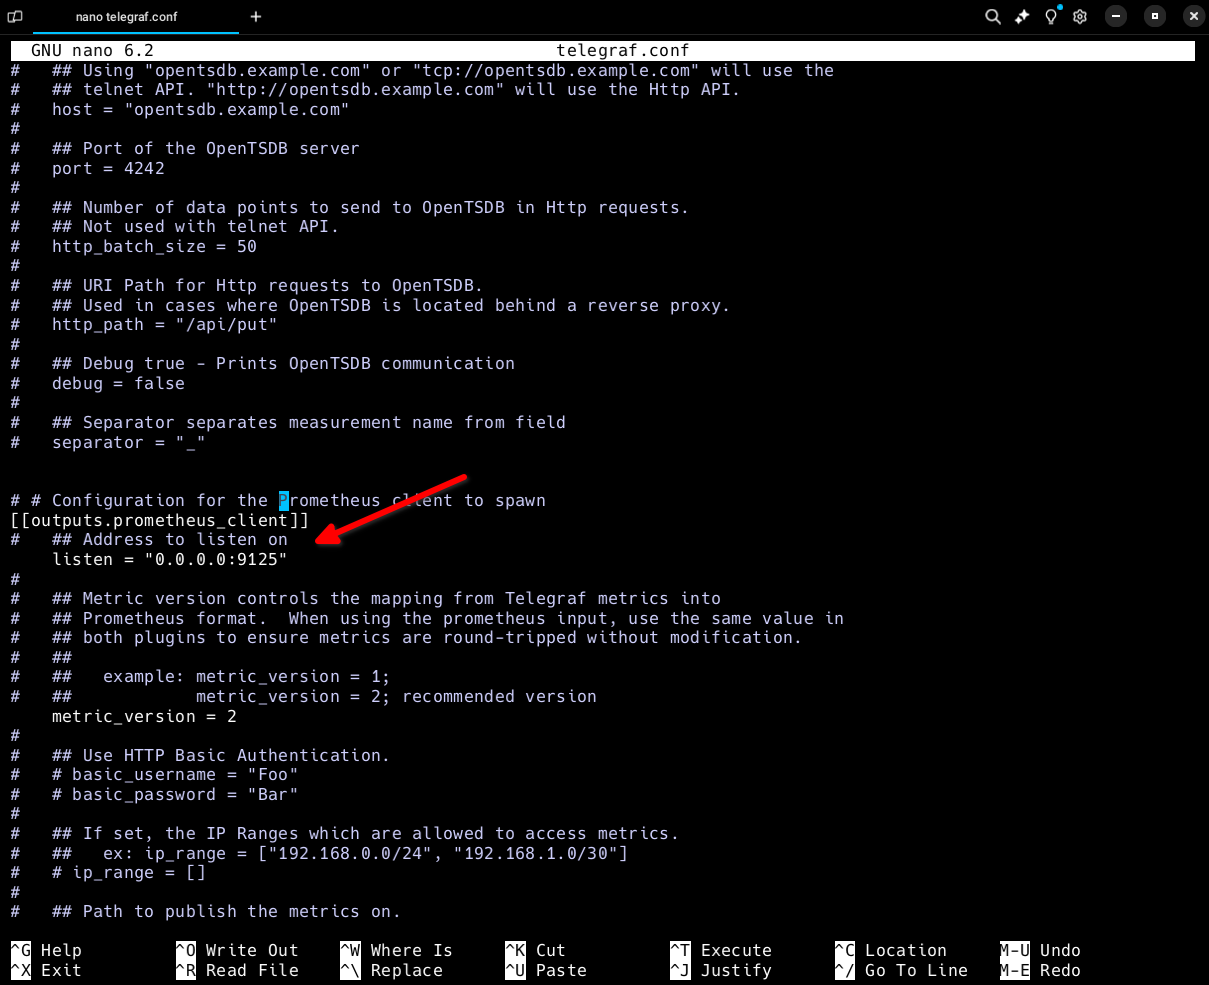
Now search for "prometheus" to get to the code section you need to modify last. This will show [[outputs.prometheus_client]] . Make sure this line is uncommented, along with listen directive.
Then change listen = "0.0.0.0:9125" Save file and exit
Lastly, use one or more of the following commands to grant "_telegraf" service full permissions for the /var/log/nginx folder. This is because it takes additional metrics from the access.log and error.log file and combines it with the Stubs metrics for pretty good stats!
Add telegraf user to www-data
NOTE: Certain Telegraf installs, the user is "telegraf" not "_telegraf". If the command above doesn't work substitute "telegraf" at the end of command.
Change Nginx Log directory owner to www-data recursively to allow telegraf to access to Nginx log files
Restart Telegraf
At this point your endpoint is now advertising metrics through telegraf on your endpoint at IP:9125 . Telegraf reads the stubs metrics from IP:81/nginx_status.
Configure Server Prometheus Scrape Jobs and Import Prebuild Grafana Dashboard
Next step is to configure the prometheus scrape jobs, I have included a template for you to fill in for each of the sites you configured above.
Below you see Node_Exporter section, target field enter the IP of your grafana server. Then the format for the job names, each job name is for each additional endpoint you configured to monitor NGINX. The job name can be whatever and is not referenced in the dashboard.
What IS important is the targets: section, this is the endpoint IP of each server you congigured. Next important note is that to get the correct label in the Dashboard, i used a relabel function. Simply change the name of 'ENDPOINT1NAME' and replacement: ENDPOINT1NAME with a user friendly name of your choice.
This is a good additional configuration, as without it, prometheus will default to using the IP:port for the instance ID. The more instances you have, the harder it is to identify. You will see what I mean further on down below the article.
NOTE: If you want additional configurations, simple copy the last job code block starting with "- job name, and ending with replacement: "
    static_configs:
      - targets: ["localhost:9090"]

  - job_name: 'Node_Exporter'
    scrape_interval: 5s
    static_configs:
      - targets: ['IPofYOURGRAFANASERVER:9100']

  - job_name: nginxendpoint1
    # If telegraf is installed, grab stats about the local
    # machine by default.
    static_configs:
      - targets: ['IPOFENDPOINT1:9125']
        labels:
          instance: 'ENDPOINT1NAME'
    relabel_configs:
      - source_labels: [__address__]
        target_label: instance
        replacement: ENDPOINT1NAME
  - job_name: nginxendpoint2
    # If telegraf is installed, grab stats about the local
    # machine by default.
    static_configs:
      - targets: ['IPOFENDPOINT2:9125']
        labels:
          instance: 'ENDPOINT2NAME'
    relabel_configs:
      - source_labels: [__address__]
        target_label: instance
        replacement: ENDPOINT2NAME
Prometheus.yml Scrape Job Configuration template
Save the file and restart prometheus on the server
Install / Import the Prebuilt Grafana dashboard for the configuration above
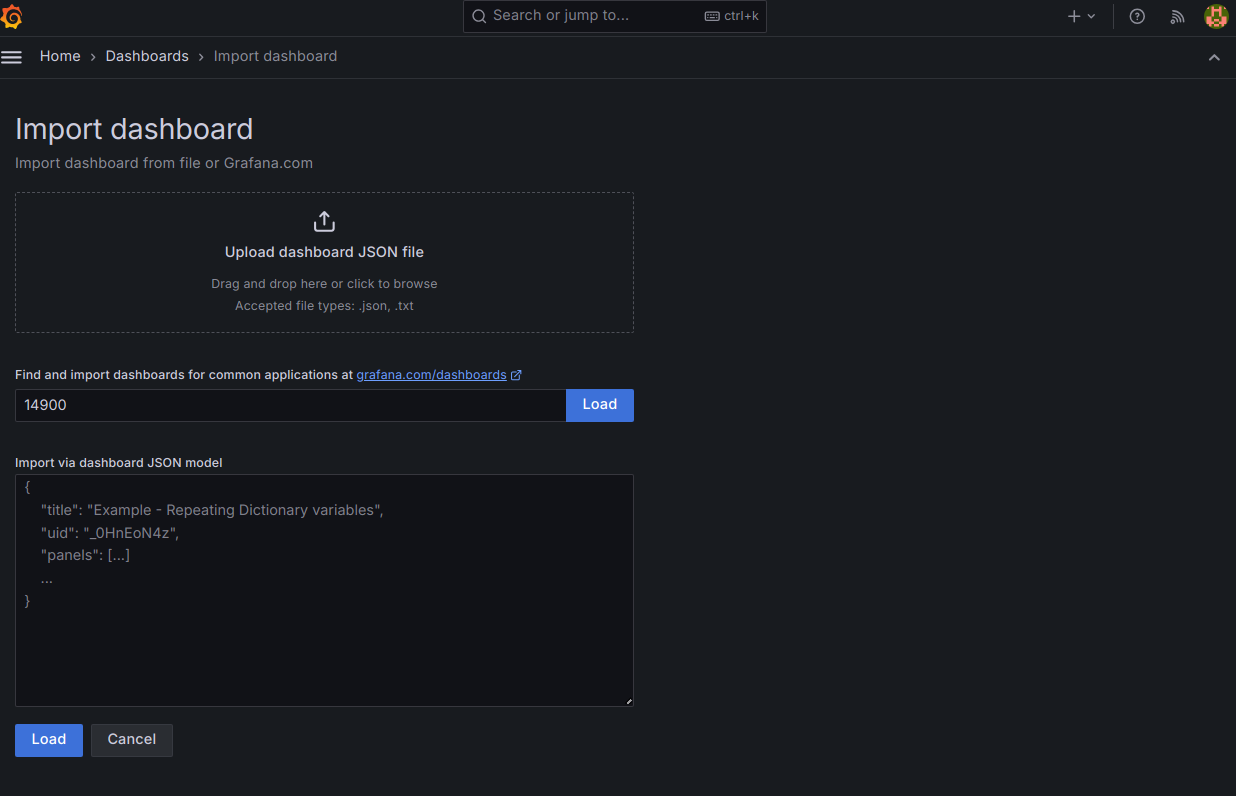
All we need to do to view the NGINX metrics data, and switch between instances we configured above. Go to Dashboards, new and import.
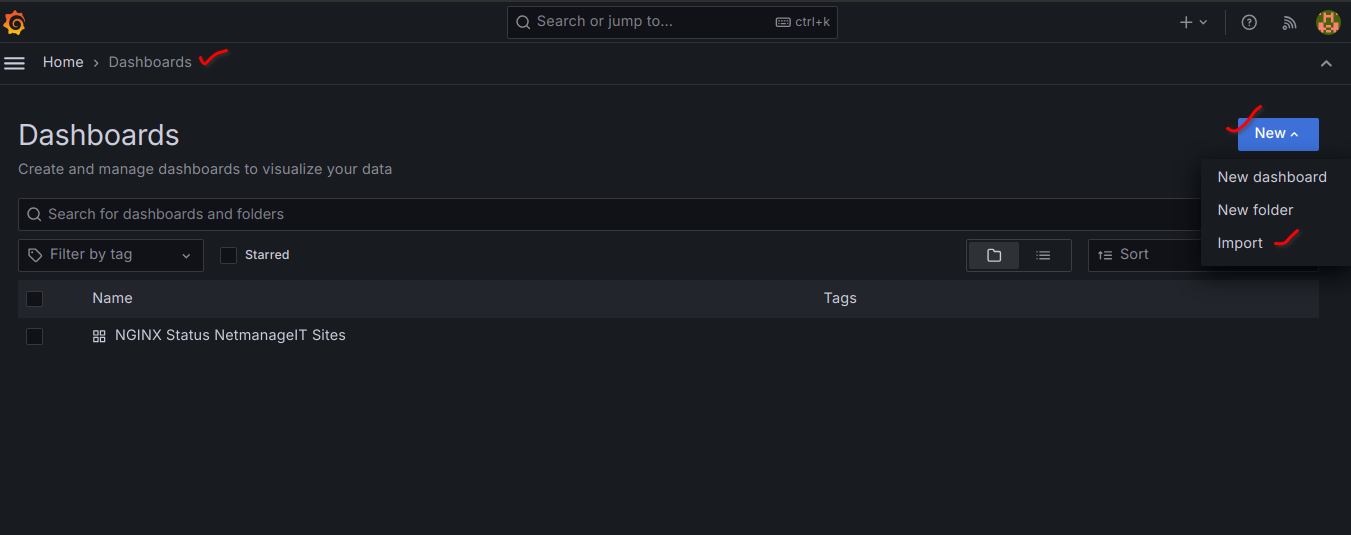
Enter Dashboard ID - "14900" and then load and finish up. You should now see the NGINX monitoring dashboard in your dashboards list.
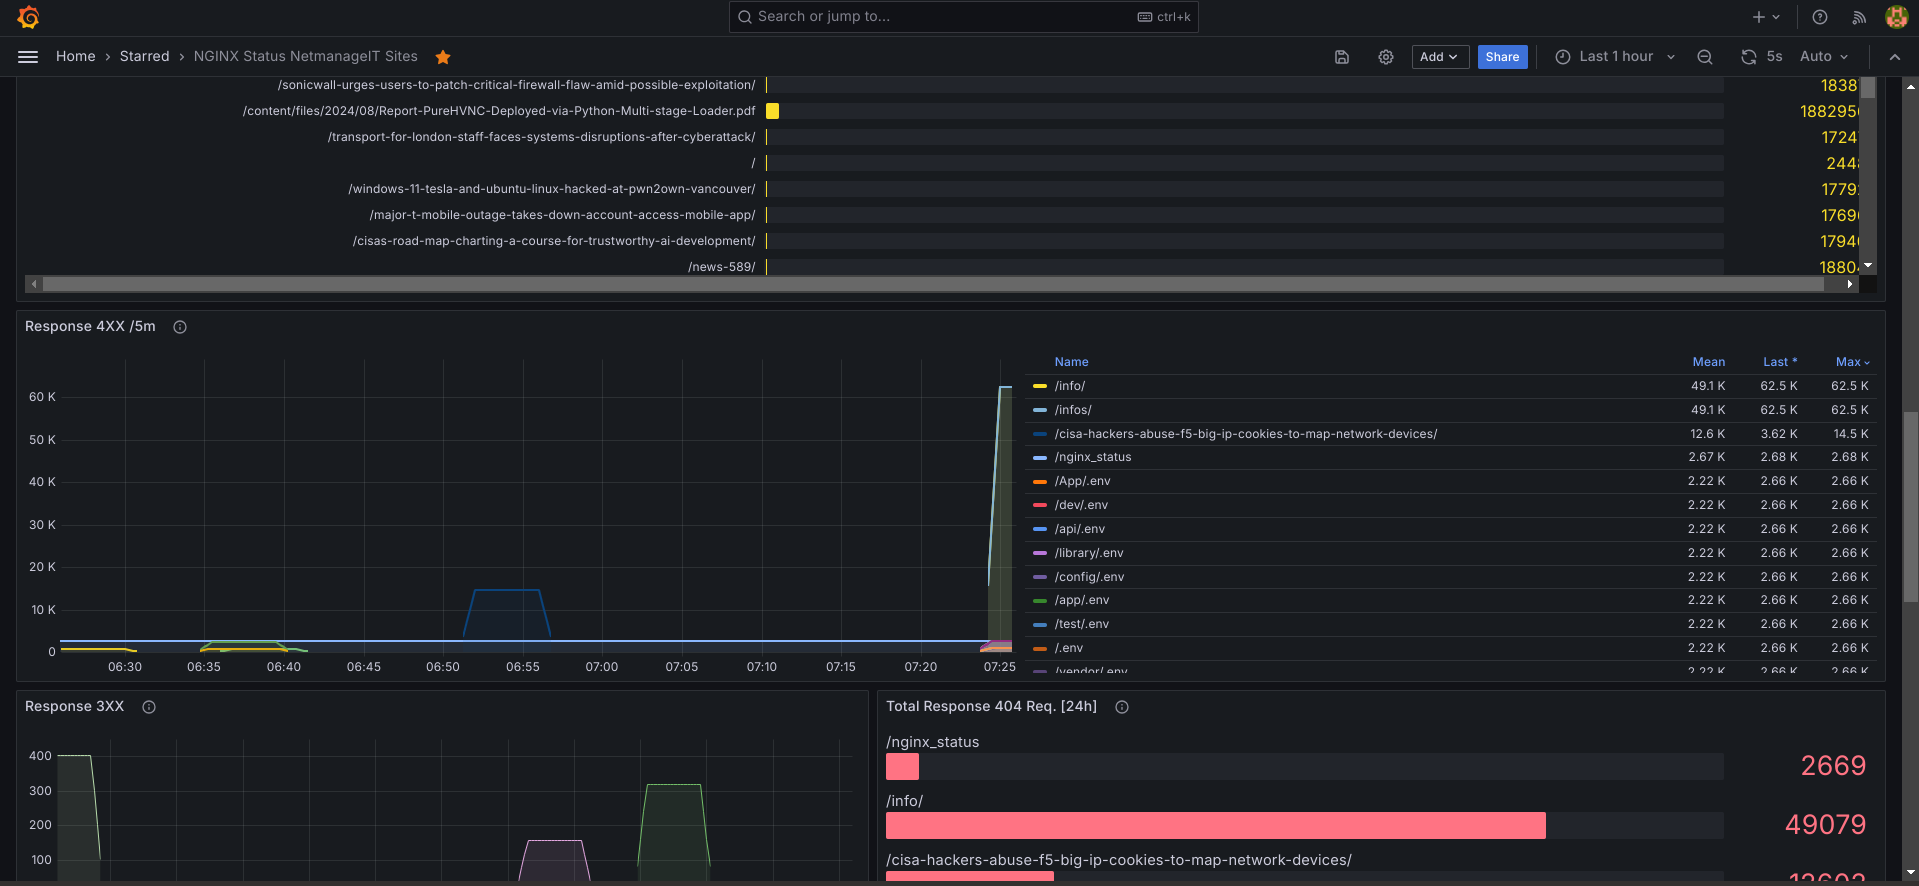
Click on it, and you can then mofidy the layout as you wish. Notice the following important top selection boxes. The only one you need to change is the "Instance" selector dropdown box. Notice all the friendly names of your configured instances we made prior in the prometheus.yml scrape configuration for each endpoint.
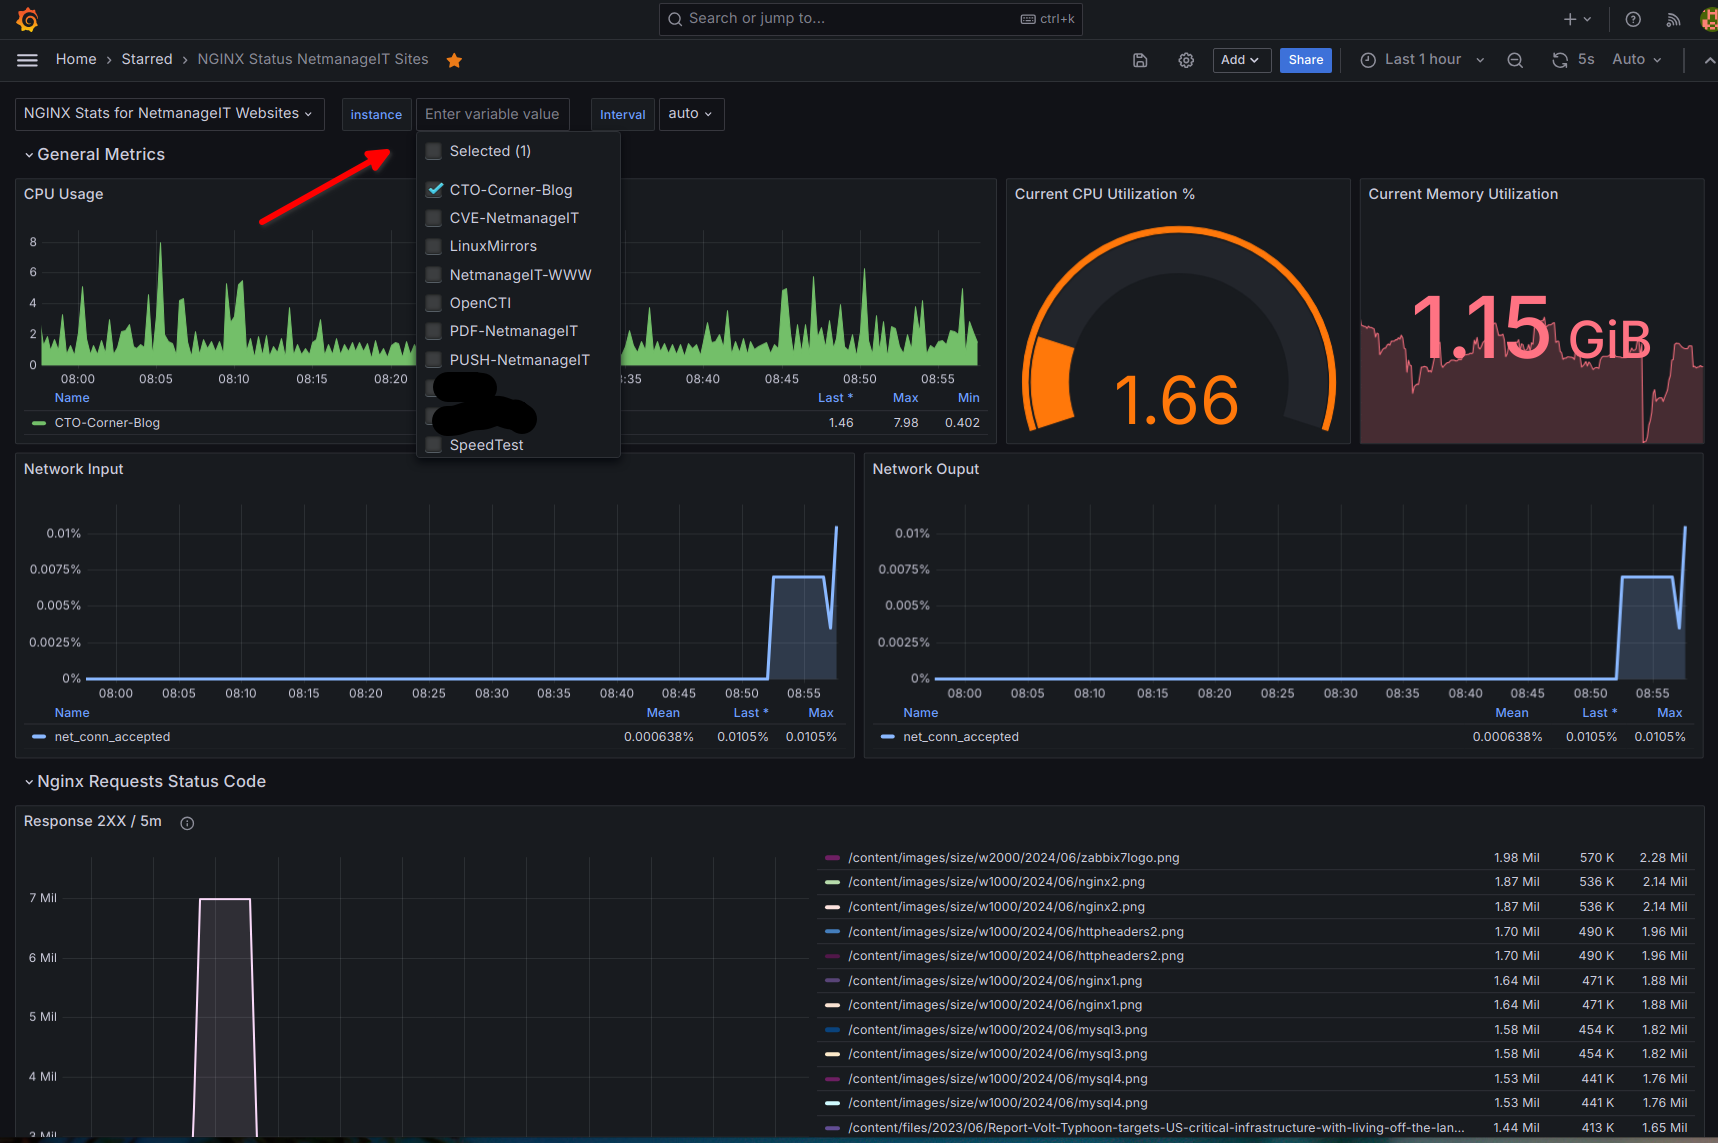
You can select one at a time, or check additional checkboxes to combine the data together. Personally I always like to just have one selected at a time, things get a bit too cluttered and messy otherwise.
Thats about it! Enjoy, and if you like the article, like and share!
God Bless
Dan