
Grafana Internet Latency, Packet Loss and Uptime Monitoring

I was playing around with Grafana recently to setup a live and historical ping, latency and packet loss dashboard for my own company use, and then figured it could be helpful to the general public. I played around with other options like SmokePing, StatPing, and Uptime Kuma. All of these options were buggy and did not seem to scale well. Plus the speed and historical comparison is so much better with this Grafana setup.
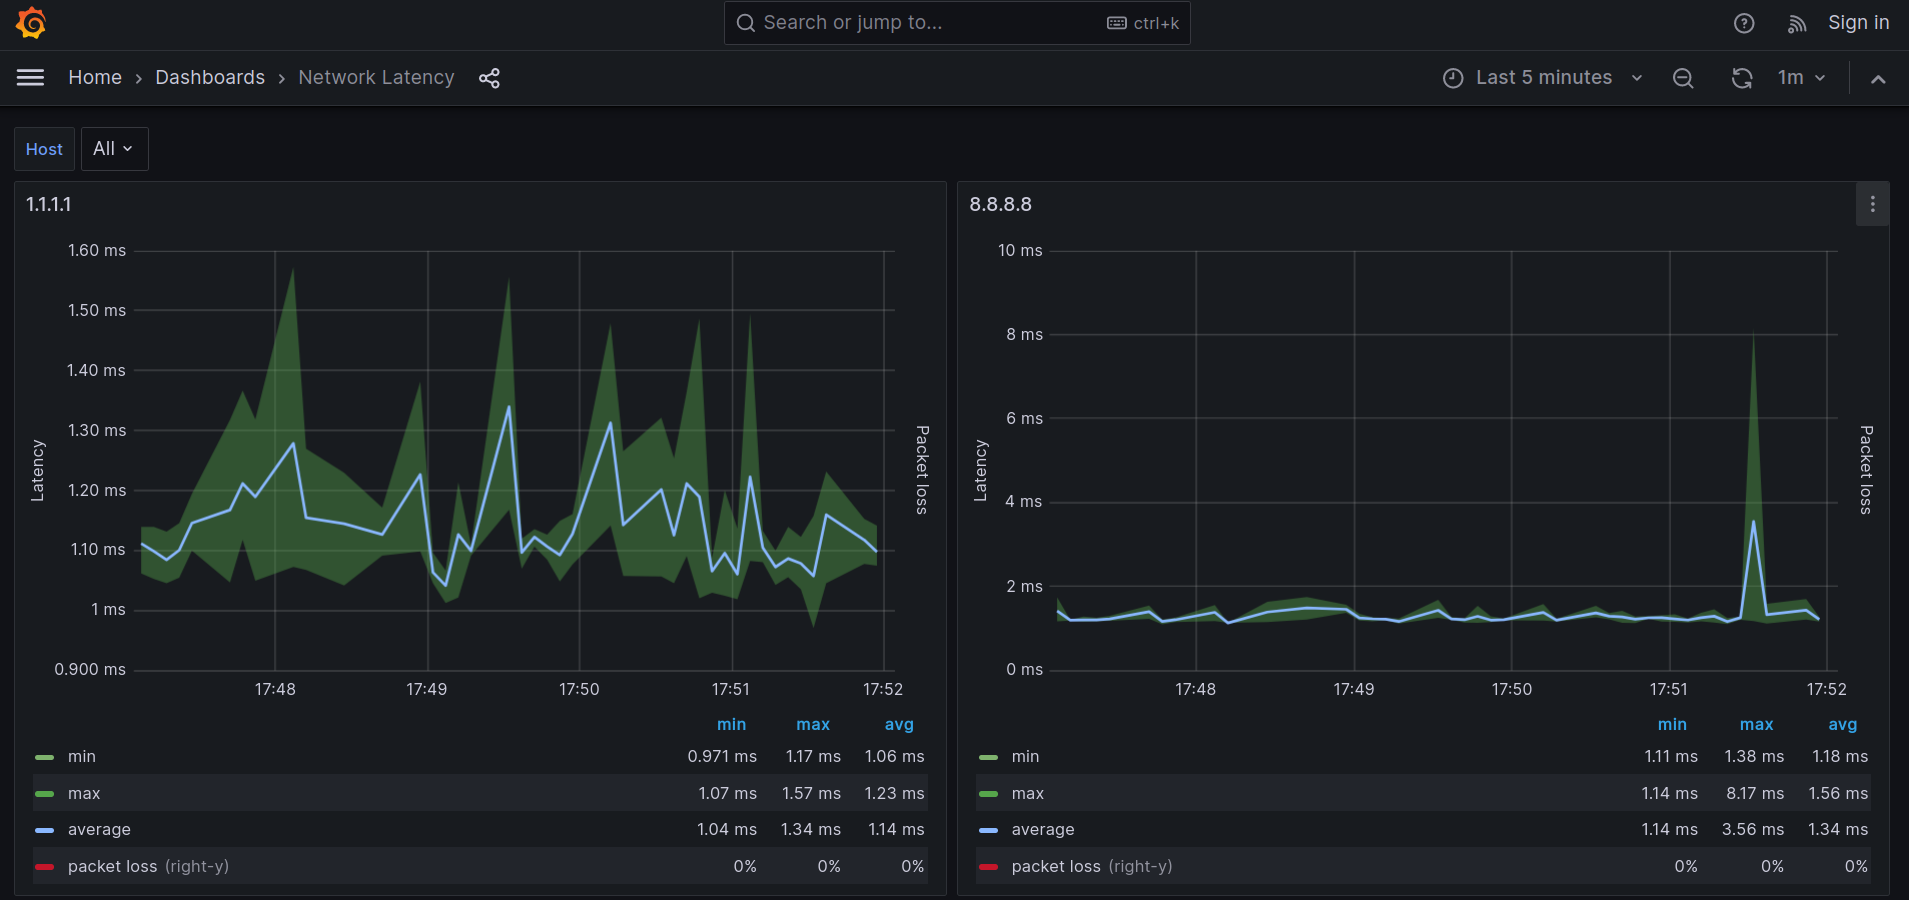
I wanted a useful birds eye visualization of real time and historical latency and packet loss issues from many of the popular ISP's, Websites and Hosting companies. So it could be helpful to troubleshoot cloud SaaS and popular website availability or network traffic issues. I thought of it like a "poor mans Down Detector", but instead of using user reports of issues plotted on a timeline then compared to baseline. It uses ping packets to measure min, max, average, jitter like variation and packet loss.
I always found Down Detector style sites helpful, but the inability to see real time latency issues or packet loss issues was a negative. Not to mention a ton of ads polluting your screen/view. This is still a work in progress, and would love feedback on how to improve or if it could be useful to many others.
If you have any other sites or network Domains/IP's you would like monitored and think would be important enough to be on the dashboard, please let me know! I will be doing more research on better domain's and IP's to get the most accurate results!
You can visit the Internet Health Grafana dashboard via the link below, or you can always just click the shortcut in the expanded menu of my blog by clicking the three horizontal dots in the upper right to the left of the Search button.
Enjoy!
Dan