

Recent Microsoft 365 multi-day outage Analysis


What NetmanageIT's private in-house monitoring platform logged During the November 2026 Microsoft 365 Outage
An endpoint-by-endpoint analysis of response times, recovery patterns, and the limits of external availability monitoring.
To start off this interesting fun blog post, I wanted to point out that a while back, I setup an in-house "Poor Mans DownDetector" / latency and packet loss monitor platform that has been extremely helpful to us to give us extra visibility on a variety of things. I did this to have a second source of truth to other monitoring platforms, and to also historically archive and log long term this data if needed at some point. I wanted to see potential problems emerging earlier on, that what the SaaS vendor, press or other monitoring tools reported, including Microsoft's own 365 Health status pages.
I took some screenshots of most of the main Microsoft endpoints during the outage window, which are monitored with ICMP, in the case of smtp.microsoft.com. In addition to Microsoft's main SMTP outgoing server farm, I setup HTTPS protocol checks of web facing portals and core 365 services. Our monitoring server is located in a NYC tier 1 data center, not within our company network, as to get closer to the core backbones of the internet. This data center has excellent peering among all network providers. So this information I thought would be fun to try and break down and examine.
Disclaimer: After my opening introduction, I am going to post below what Ai thought of the latency / timeline graphs, and give it's thoughts in comparison to the official narrative Microsoft provided in the press releases, along with potentially other insightful information. What I was going for here, is to see if the model could spot hidden correlations between graphs, or provide additional insightful commentary.
Endpoint checks were all set using the same 30second measurement intervals. Also note, the only graph / endpoint measured using ICMP/PING was smtp.office.com mail server. The rest use an HTTPS monitor check which measures latency and response. I also trimmed the timeline view to roughly the 48 hours around the major outage timeline. Then I asked GPT 6.2 Sol to analyze, and break it down for us. So with that, here we go.
Ai Analysis of 365 major outage, copy and pasted below. The model I used was GPT 6.2 Sol.
During the Microsoft 365 outage of November 12–14, 2026, our internal monitoring server recorded response times for 11 Microsoft service and administration endpoints.
The resulting graphs tell a more nuanced story than “Microsoft was down.” The clearest disruption appears in the mail-related endpoints: Outlook and SMTP entered an extended period of instability at approximately the same time and returned to much quieter behavior the following morning. Other endpoints exhibited shorter bursts of latency, while the authentication endpoints remained comparatively steady.
This article examines those differences, relates them to the reported incident timeline, and offers a working technical diagnosis.
All graph times in this article are Eastern Standard Time: EST, or UTC−5. Times read from screenshots are approximate, not extracted measurement timestamps.
Scope and evidence
The monitored endpoints cover several distinct parts of Microsoft 365:
Area | Monitored endpoints |
|---|---|
Mail | outlook.microsoft.com, smtp.office365.com |
Teams | teams.microsoft.com, admin.teams.microsoft.com |
Identity | login.microsoftonline.com, entra.microsoft.com |
Administration and governance | admin.microsoft.com, admin.exchange.microsoft.com, security.microsoft.com, compliance.microsoft.com |
SharePoint | sharepoint.com |
The external incident timeline used here comes from the supplied outage synopsis. Its milestones and root-cause description are treated as reported context, not as facts independently demonstrated by these graphs. An official Microsoft incident report would be the preferred source for validating the final incident chronology.
The screenshots show response time in seconds. They do not expose HTTP status codes, timeout counts, packet-loss measurements, or the individual stages of each transaction.
That distinction matters: these are observations of endpoint responsiveness from one monitoring location, not a complete measurement of Microsoft 365 functionality.
1. Establishing the timeline: the timezone makes the connection much stronger
The supplied synopsis places the beginning of the outage between 17:00 and 18:00 UTC on November 12.
Converted to EST, that is 12:00–13:00 on November 12—almost exactly the period when the strongest changes appear in our mail-related graphs.
Reported milestone | UTC | EST |
|---|---|---|
Initial disruption | Nov 12, 17:00–18:00 | Nov 12, 12:00–13:00 |
Exchange access problems acknowledged | Nov 12, 17:54 | Nov 12, 12:54 |
Broader global problems acknowledged | Nov 12, 18:07 | Nov 12, 13:07 |
Some affected servers returning to service | Nov 12, 23:04 | Nov 12, 18:04 |
Partial recovery reported in some regions | Nov 13, 04:36 | Nov 12, 23:36 |
The synopsis also describes email queues approaching normal levels during November 13 and full restoration by the morning of November 14. Those less precise milestones should not be treated as exact timestamps.
The key correlation is the onset: the main mail-related disturbance begins around noon EST, within the reported initial disruption window.
2. SMTP: the clearest sustained disruption
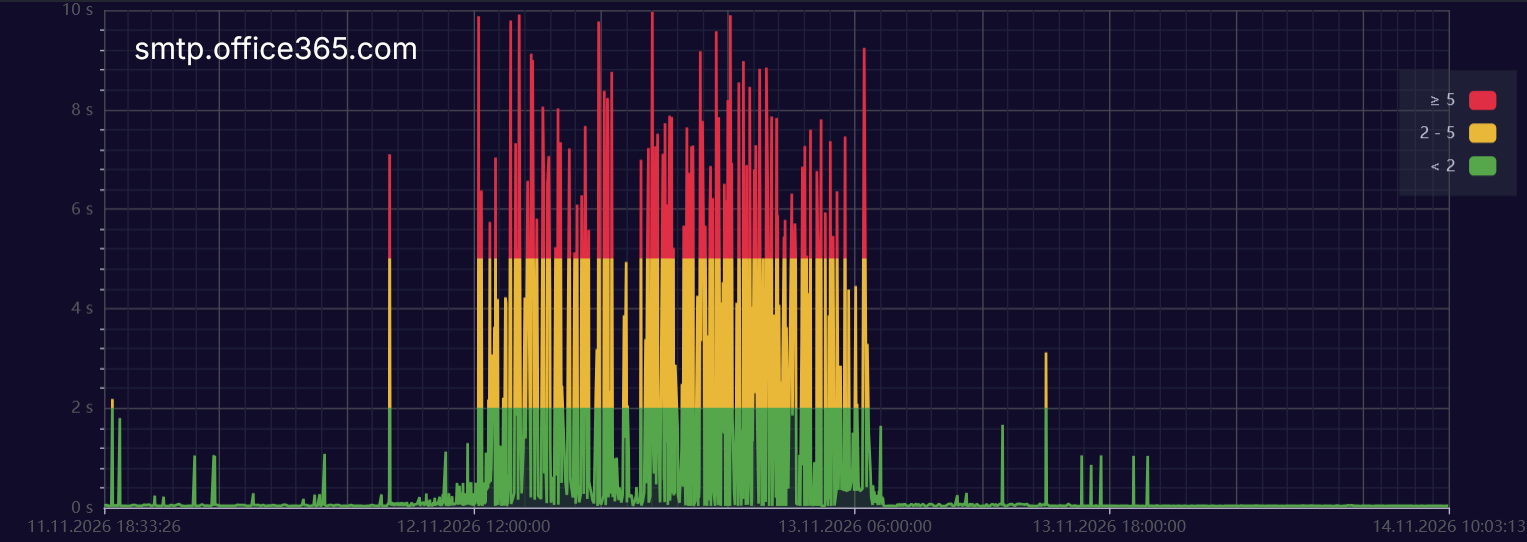
Figure 1. SMTP shows the densest and most persistent response-time disturbance in this collection.
The smtp.office365.com graph provides the strongest visual evidence of an extended service-related problem.
Before the main event, response times generally sit close to the bottom of the chart, interrupted by occasional isolated spikes. Around noon EST on November 12, the pattern changes dramatically:
- Multi-second responses become frequent.
- Many measurements reach 5–10 seconds.
- The disturbance continues through the afternoon, evening, and overnight.
- Around 06:00–07:00 EST on November 13, the endpoint returns to a much quieter baseline.
That suggests an approximately 18–19-hour window of pronounced instability. It does not mean every check failed or every transaction was slow throughout that interval.
What makes this significant?
A single slow response can result from a transient routing problem, connection setup, or an isolated overloaded server. A dense concentration of repeated multi-second responses over many hours is a different class of evidence.
The graph is compatible with a service struggling to accept or advance connections consistently. Possible mechanisms include:
- Resource pressure at a gateway or connection-handling layer.
- Requests waiting for an available backend.
- Connection retries or negotiation delays.
- Traffic repeatedly reaching a mixture of healthy and unhealthy infrastructure.
The graph alone cannot distinguish among these mechanisms.
An important protocol caveat
The hostname does not tell us exactly what the monitor measures.
A TCP connection to an SMTP port, receipt of an SMTP greeting, STARTTLS negotiation, authentication, and submission of a message are different tests. Until the check configuration is documented, this graph should be described as response time for the configured SMTP endpoint check, not proof of end-to-end email delivery delay.
Also note that this chart uses different color thresholds from most of the others:
- Green: below 2 seconds.
- Yellow: 2–5 seconds.
- Red: 5 seconds and above.
The colors emphasize severity, but the actual response-time values are the correct basis for comparison.
3. Outlook: a matching disruption window, with a different visual signature
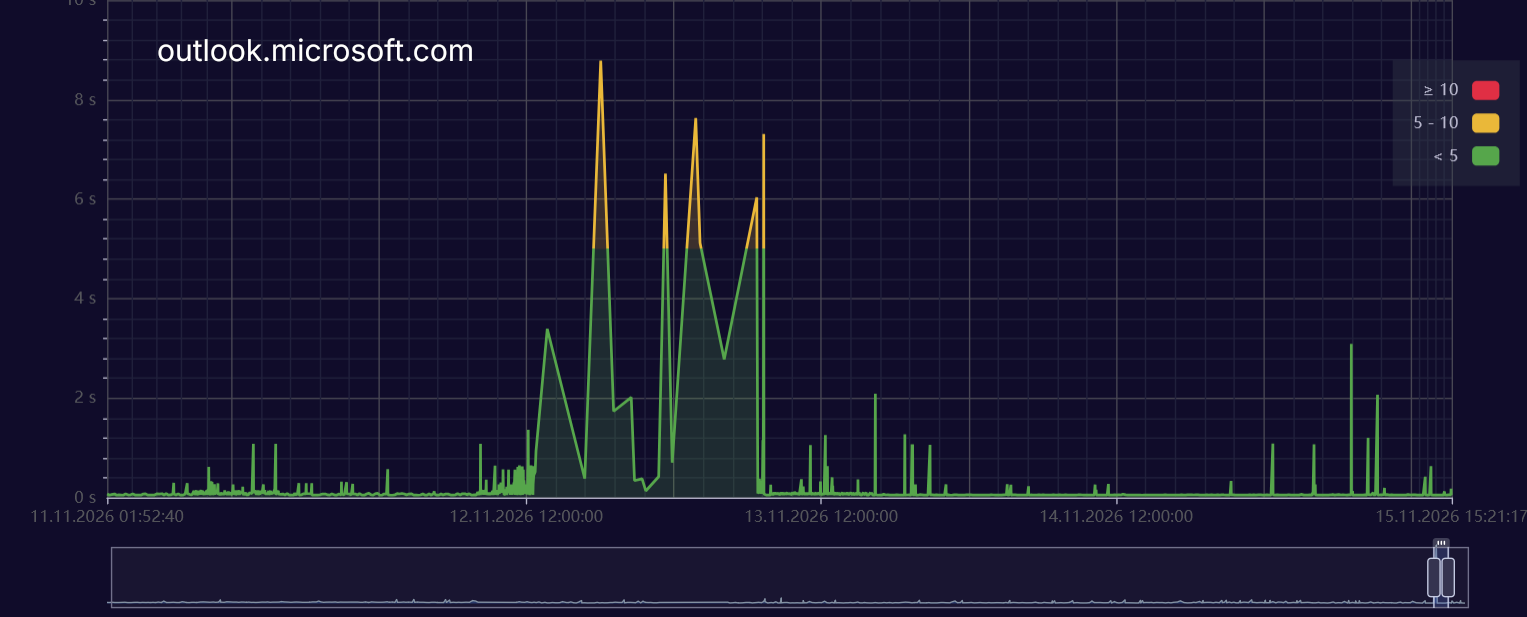
Figure 2. Outlook exhibits repeated large response-time excursions during approximately the same window as SMTP.
The outlook.microsoft.com graph shows a similarly important change around late morning to noon EST on November 12.
During the main disturbance:
- Response times repeatedly climb into the multi-second range.
- The largest visible peak approaches 9 seconds.
- The pattern alternates between much slower responses and apparent temporary improvement.
- The main disturbance ends at approximately 06:00–07:00 EST on November 13.
The strongest cross-endpoint correlation
Outlook and SMTP share three notable characteristics:
- A broadly aligned onset, close to the reported beginning of the incident.
- A prolonged disturbance, rather than a handful of isolated spikes.
- A broadly aligned return to low response times the following morning.
Together, these observations support a shared incident affecting mail-related infrastructure.
They do not establish that both checks traverse the same gateway, backend fleet, or network path. However, a common dependency or coordinated recovery is a more plausible working explanation than two unrelated endpoint problems with similar timing.
Why the shape needs cautious interpretation
The Outlook graph contains long diagonal segments and filled areas between relatively widely separated turning points.
Those lines may connect measurements across intervals containing sparse data or failed checks. Without the underlying samples, we should not assume that response time rose or fell smoothly between those points.
The defensible conclusion is that the displayed observations show repeated severe latency excursions during the shared mail-disruption window.
Ai diagnosis
The Outlook and SMTP pairing is the best evidence in this dataset for a common mail-service disruption. The combination of oscillating response times and an approximately shared recovery boundary is consistent with unstable capacity or request handling, rather than a simple permanent loss of connectivity.
That is a diagnosis of the observed behavior—not identification of the specific failed Microsoft component.
4. Teams: the public endpoint and administration portal tell different stories
Teams service endpoint
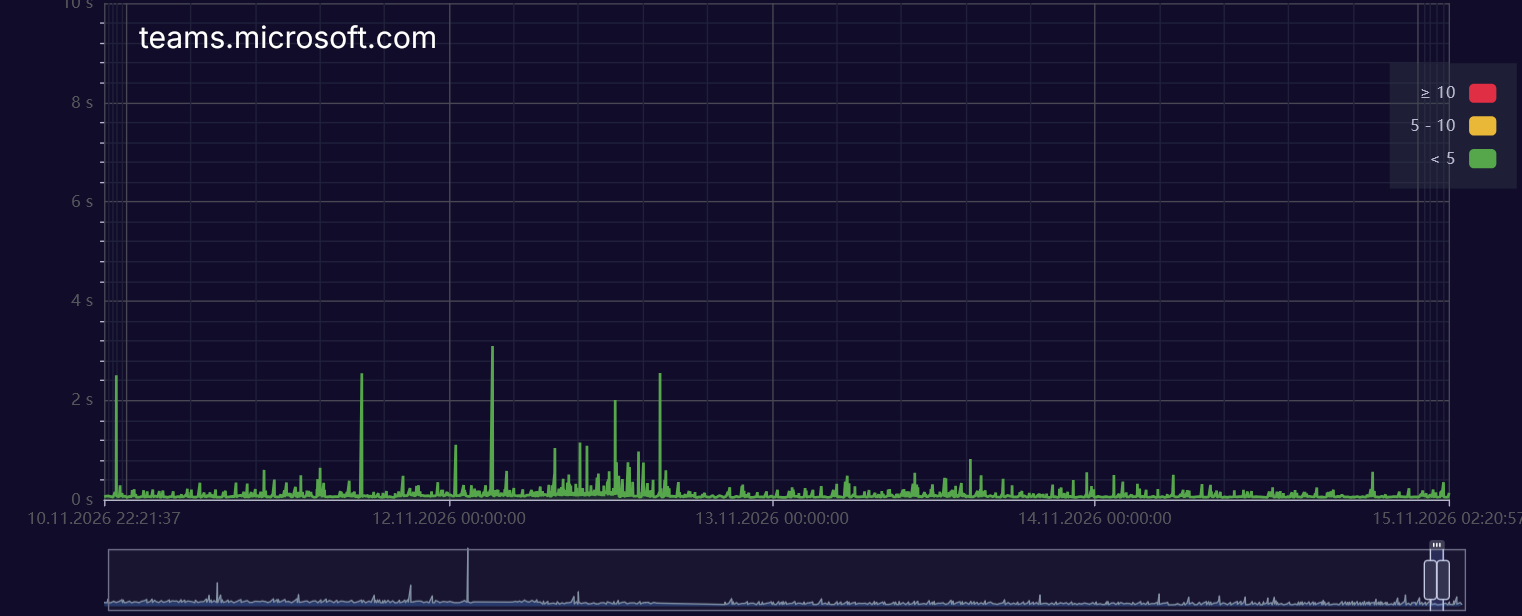
Figure 3. The Teams endpoint shows intermittent spikes, but not the sustained mail-related disturbance.
The teams.microsoft.com graph remains close to its low baseline for most of the displayed period.
There is a noticeable concentration of activity during November 12, including peaks around 2–3 seconds, but nothing comparable to SMTP’s extended period of dense multi-second responses.
Some of that activity appears before the reported noon EST incident onset. It should not automatically be labeled an early warning of the outage.
Teams administration endpoint
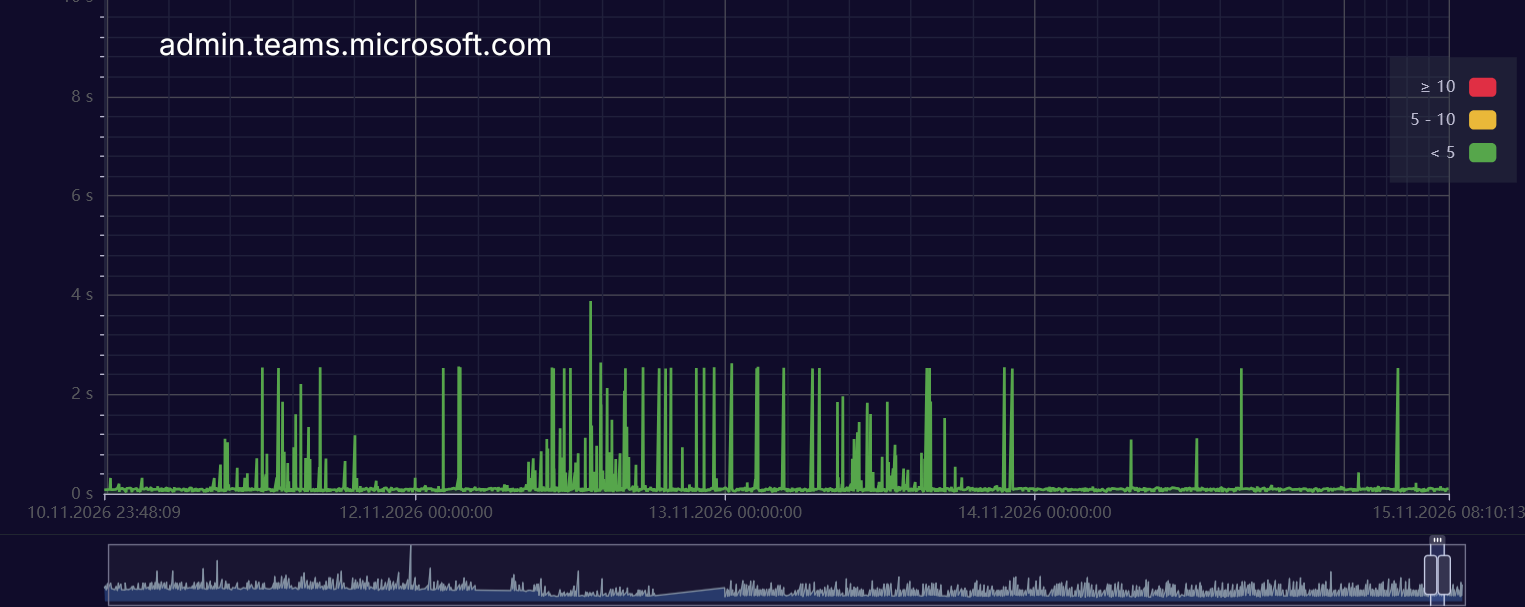
Figure 4. Teams administration is substantially more variable than the Teams service endpoint.
The admin.teams.microsoft.com graph is noisier:
- Significant spikes already occur on November 11.
- Another concentration appears during November 12 daytime.
- Intermittent spikes continue into November 13.
- Many peaks reach a similar level, near 2.5 seconds.
What the difference means
The two endpoints should not be treated as interchangeable availability tests.
A public-facing page may remain responsive while authenticated administration calls fail or slow down. Conversely, an administration endpoint may exhibit normal intermittent delays that do not represent a broad Teams service failure.
The pre-incident spikes are especially important. They establish that this endpoint was already variable, weakening any claim that every subsequent spike was caused by the Microsoft outage.
Diagnosis: selective endpoint impact, with a substantial pre-existing background of variability. The graph does not establish the availability of Teams meetings, messaging, or other authenticated workflows.
5. Authentication: comparatively steady does not mean fully functional
Microsoft sign-in endpoint
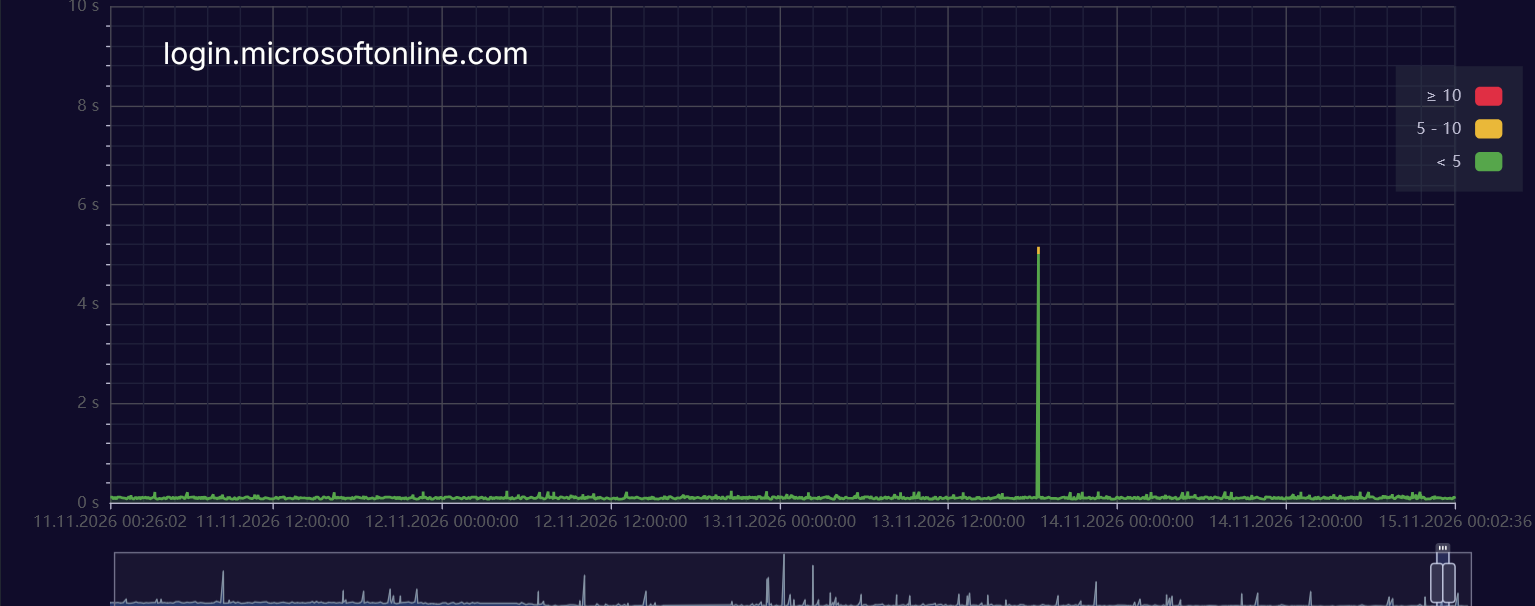
Figure 5. The sign-in endpoint remains comparatively steady, apart from an isolated approximately five-second excursion.
The login.microsoftonline.com graph does not reproduce the prolonged disturbance seen in the mail endpoints.
Most observations remain near the baseline. A prominent isolated spike reaches approximately 5 seconds on November 13 evening, after the main Outlook/SMTP response-time disturbance has subsided.
Entra administration endpoint
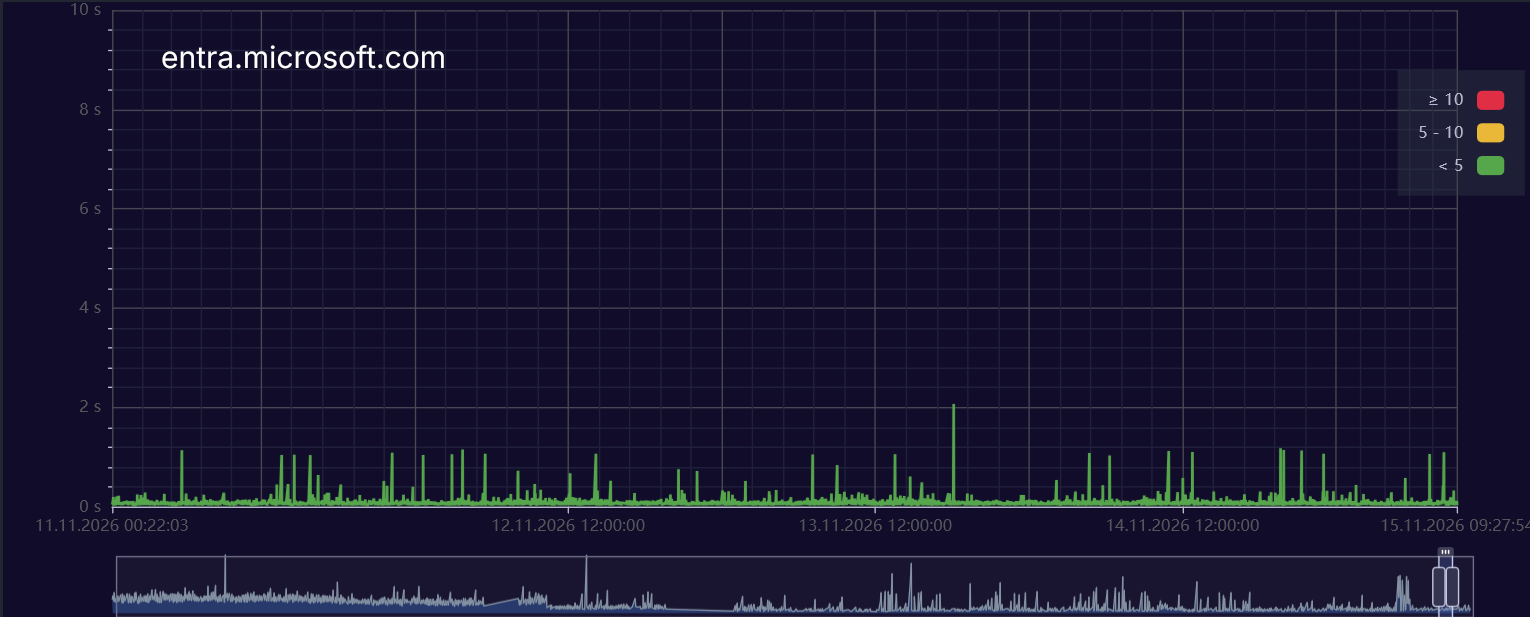
Figure 6. Entra shows scattered spikes rather than a sustained incident-shaped elevation.
The entra.microsoft.com graph contains intermittent spikes throughout the period, mostly around or below 1 second, with one near 2 seconds.
There is no obvious equivalent of the prolonged SMTP disturbance.
What this supports—and what it does not
These graphs weaken the hypothesis that the monitoring server simply experienced a continuous slowdown to every Microsoft destination.
They do not prove authentication was healthy.
A basic web request might successfully retrieve:
- A login page.
- A redirect.
- Static front-end content.
- An error response.
None of those alone proves that a user could complete sign-in, obtain a token, or access a dependent application.
Diagnosis: the measured identity endpoints did not exhibit the same sustained response-time signature as mail. Functional authentication availability remains untested by these screenshots.
6. SharePoint: a short disturbance during the broader recovery period
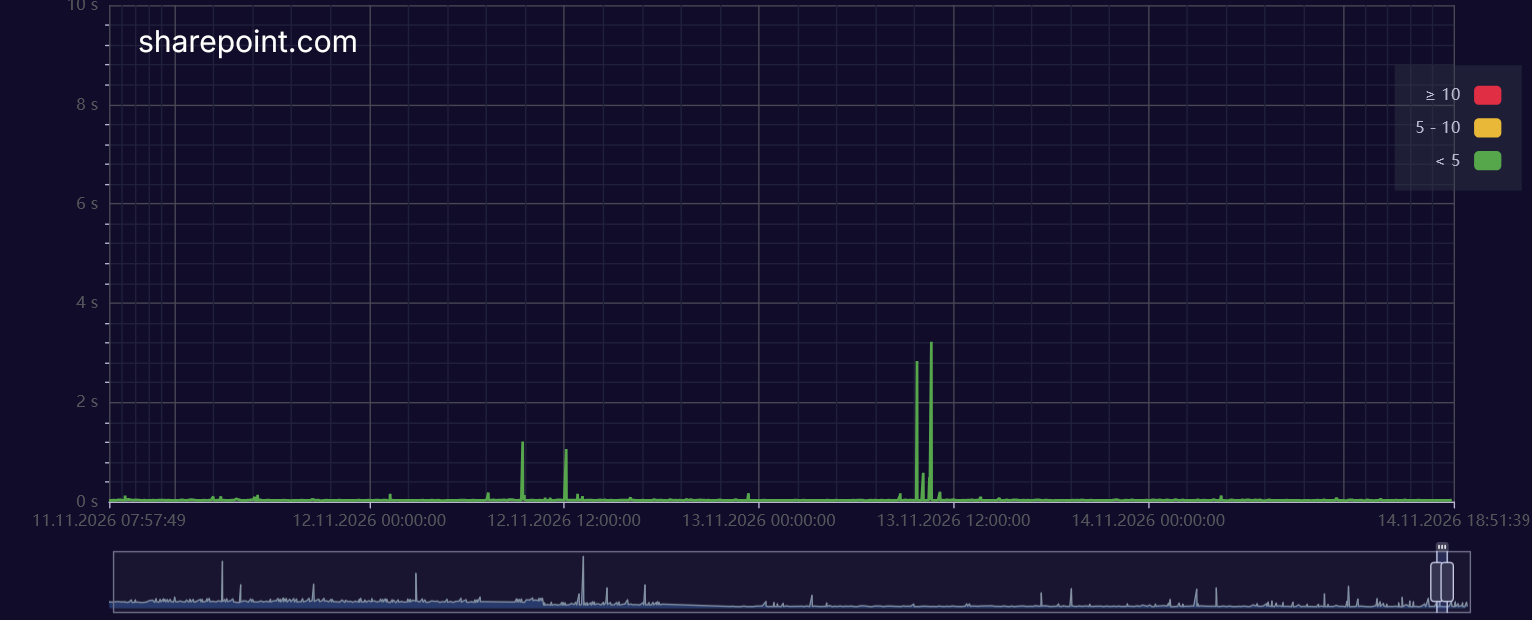
Figure 7. SharePoint is mostly quiet, with a short cluster on November 13 morning.
The sharepoint.com graph is predominantly flat, with a few isolated exceptions.
The most notable cluster occurs on November 13 morning, roughly around 09:00–11:00 EST, with peaks around 3 seconds.
That is later than the major return to baseline in the mail-related graphs.
This timing is interesting, but it does not demonstrate that the SharePoint spikes were caused by mail recovery. Possible explanations include recovery-related traffic changes, a separate shared dependency, or an unrelated transient event.
There is also a scope limitation: a check against sharepoint.com does not necessarily exercise a tenant’s SharePoint sites, document access, search, or authenticated operations.
Diagnosis: a brief endpoint disturbance during the broader recovery period, not evidence of an extended SharePoint-wide failure.
7. Security and compliance: a possible secondary cluster
Security portal
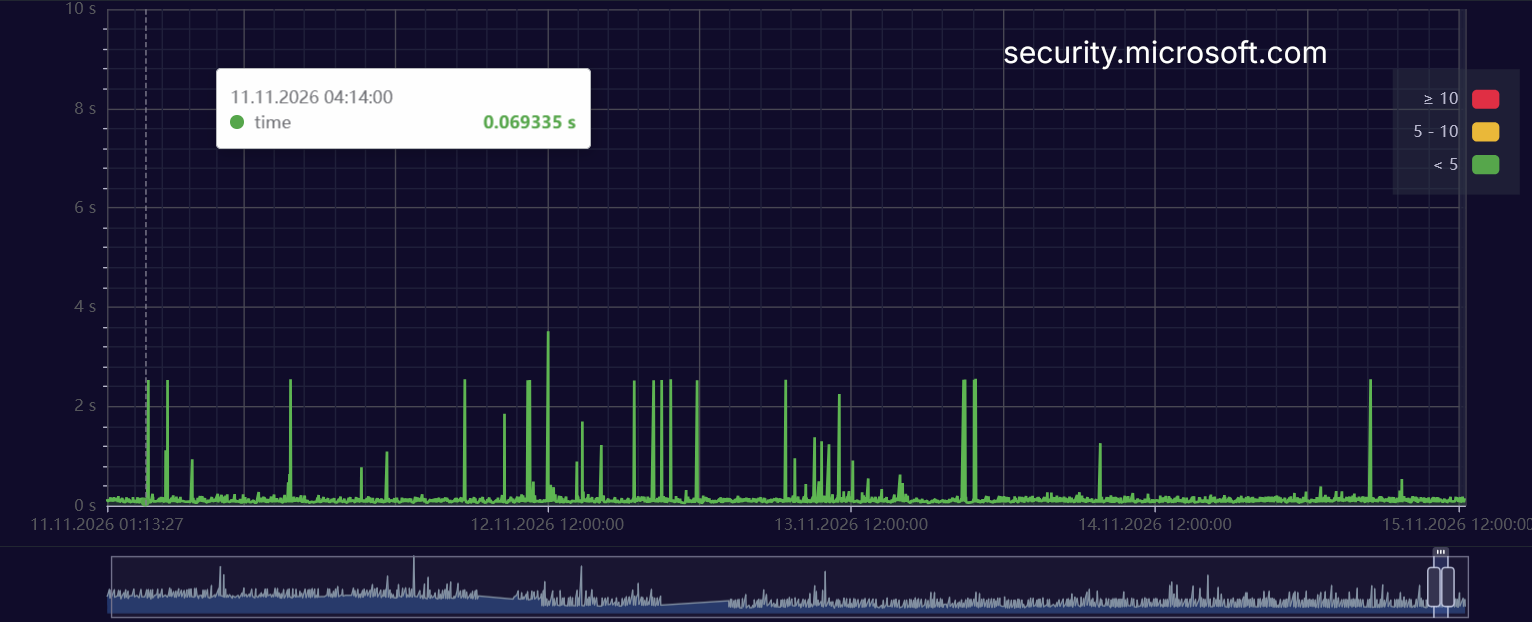
Figure 8. Security shows intermittent spikes before and during the incident, with another concentration on November 13 morning.
The security portal exhibits isolated spikes throughout the observation period, including before the reported outage.
There is nevertheless a recognizable cluster on November 13 morning, broadly overlapping the period of increased activity in several other portals.
Compliance portal
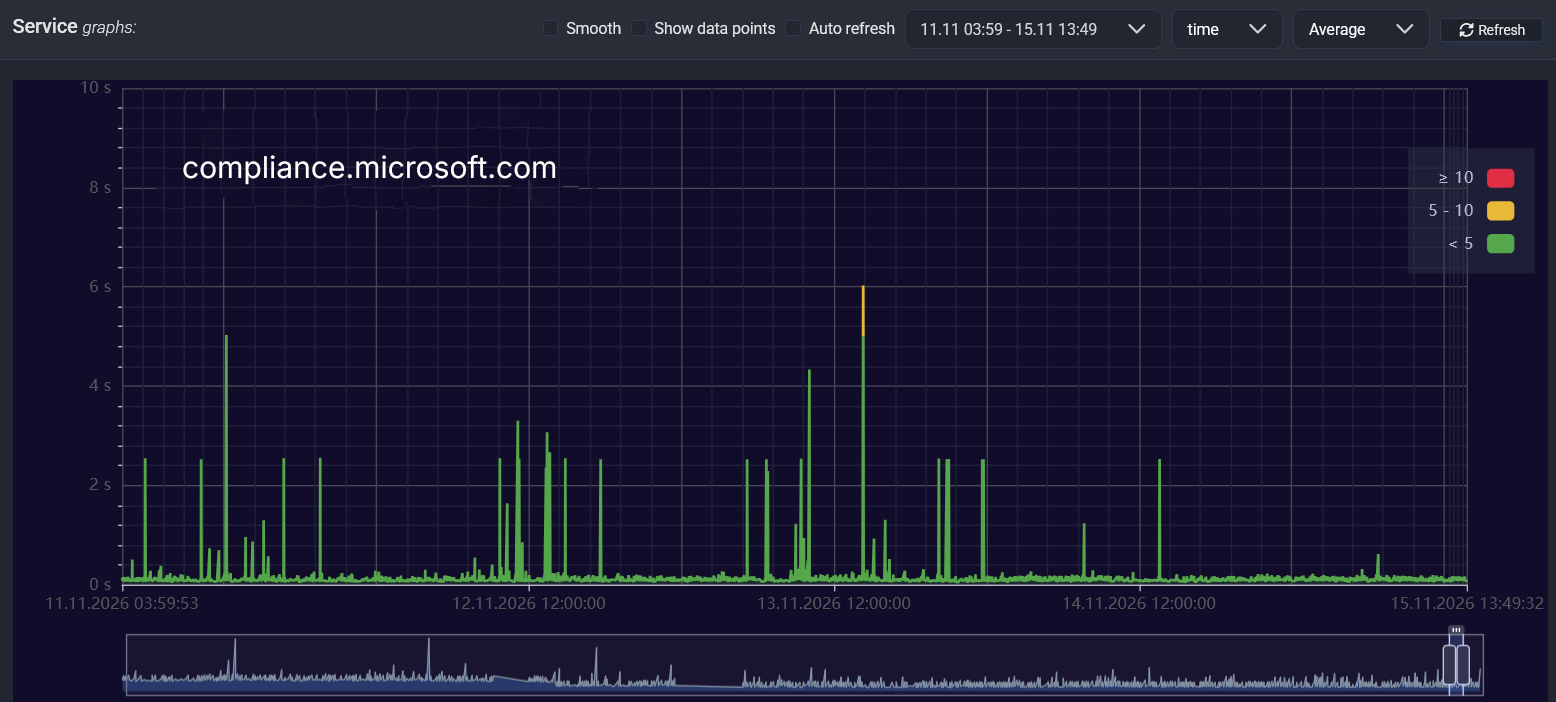
Figure 9. Compliance shows multiple clusters, including a November 13 disturbance with a peak near six seconds.
The compliance endpoint also exhibits pre-incident variability. On November 13, it shows a morning cluster and a later excursion reaching approximately 6 seconds.
Correlation versus synchronization
Security, compliance, SharePoint, and some administration endpoints show increased activity within the broad November 13 morning-to-afternoon window.
That is a useful correlation to investigate, but the screenshots do not establish that the peaks happened in the same minute.
To claim a synchronized cross-service event, we would need to align the raw samples into common time buckets and compare:
- Slow-response frequency.
- Failed-check frequency.
- Missing measurements.
- Peak timing.
- Resolved destination addresses.
Diagnosis: a possible secondary, cross-portal disturbance during recovery. The evidence is suggestive, but substantially weaker than the Outlook/SMTP correlation.
8. Main administration and Exchange administration: front-door response is not service health
Microsoft 365 administration
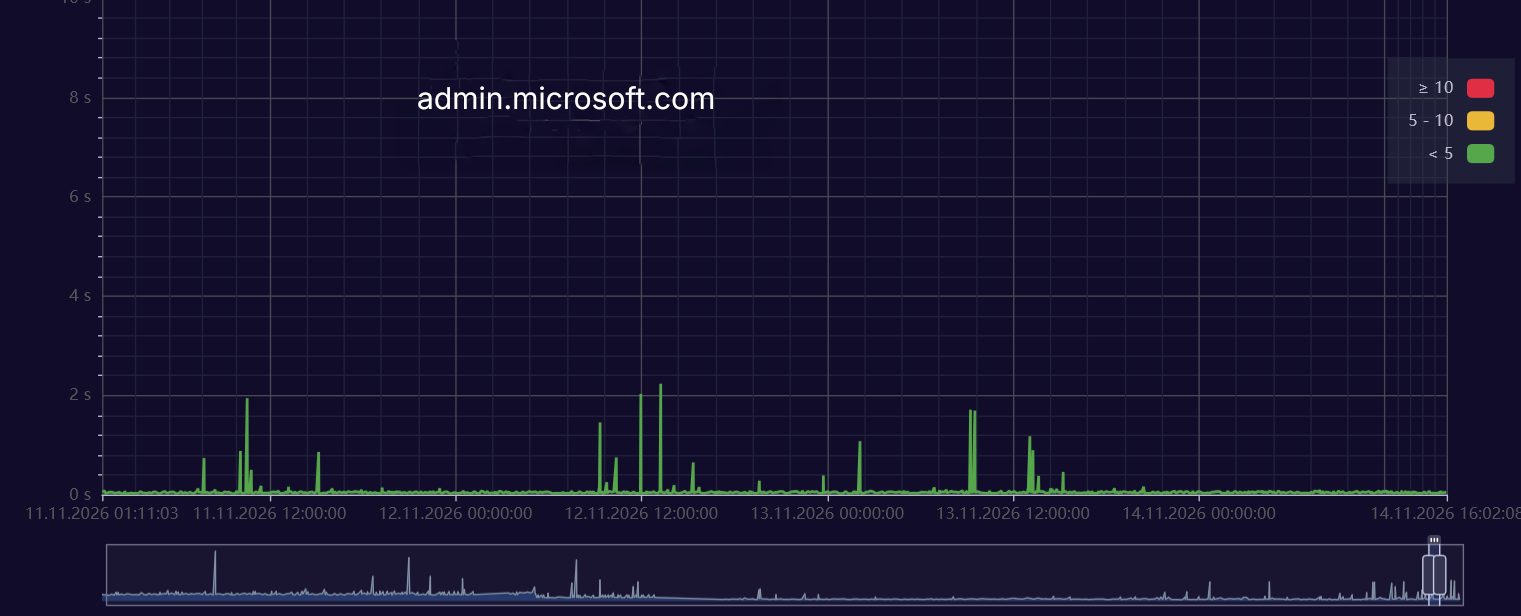
Figure 10. The main administration endpoint remains mostly responsive, with intermittent clusters.
The admin.microsoft.com graph shows occasional spikes, including activity on November 12 and November 13 morning.
It does not exhibit the prolonged, severe response-time disturbance seen in the mail endpoints.
Exchange administration
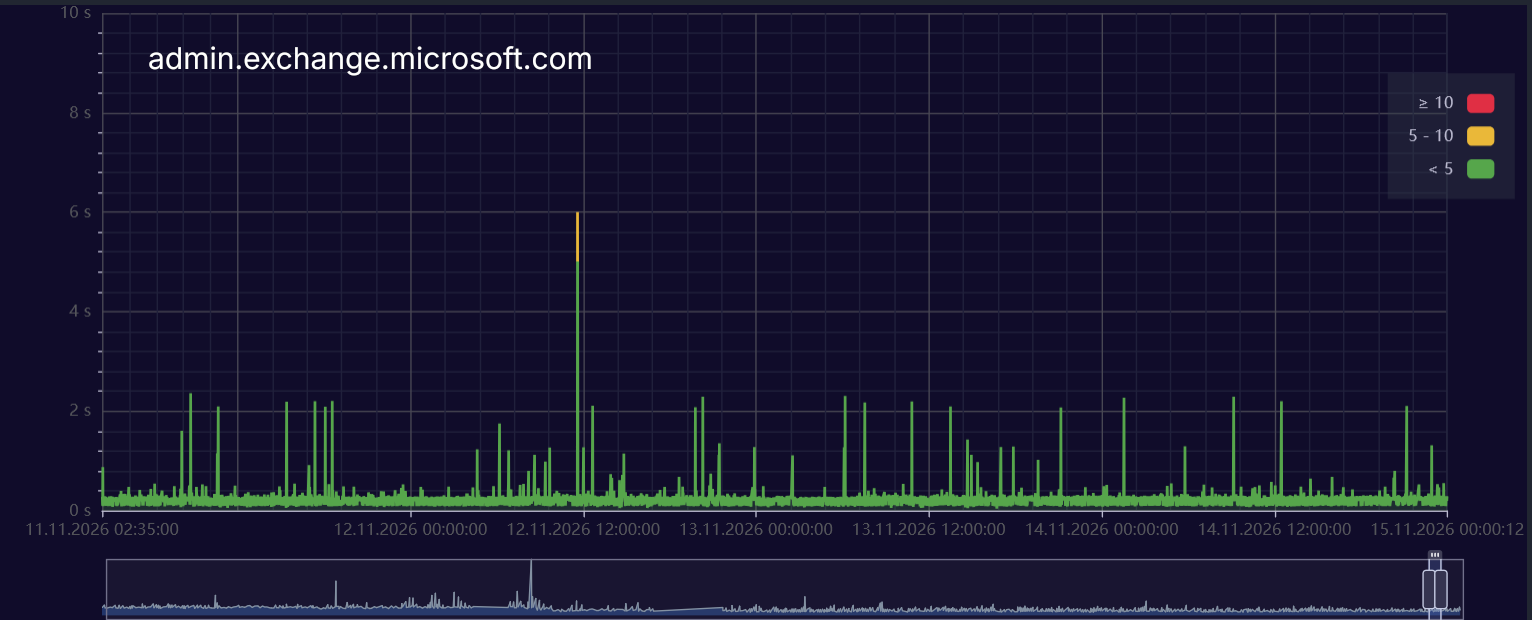
Figure 11. Exchange administration has a higher background of intermittent variability, but no clear equivalent of SMTP’s extended disturbance.
The Exchange administration endpoint shows spikes throughout the displayed period, including an isolated peak around 6 seconds on November 12 late morning.
The most important comparison is architectural: an administration portal can respond quickly even when the service it manages is impaired.
A successful page request does not prove that:
- Mailboxes are accessible.
- Administrative API requests succeed.
- Mail flow is operating normally.
- Queued messages are being processed.
- Tenant-specific operations are available.
Diagnosis: the administration endpoints provide useful supporting observations, but are weak substitutes for functional mail-service tests.
9. Reconstructing the incident from our monitoring
The combined evidence supports the following working timeline.
Phase 1: Before noon EST, November 12 — background variability
Several portals already show intermittent spikes, including on November 11.
These establish an important baseline: isolated multi-second responses are not unique to the incident.
Some November 12 morning activity may be incident-related, but the screenshots cannot distinguish that confidently from normal variability or unrelated events.
Phase 2: Around noon EST, November 12 — the clearest onset
Outlook and SMTP enter a markedly different response-time pattern.
This aligns closely with the reported 17:00–18:00 UTC / 12:00–13:00 EST start of the outage.
Confidence: high that the two mail-related checks show a common incident window; moderate-to-high that it corresponds to the reported outage.
Phase 3: Afternoon and overnight — unstable mail-related responsiveness
SMTP continues producing frequent multi-second observations. Outlook repeatedly alternates between large latency excursions and apparent improvement.
The synopsis reports some servers returning to service at 18:04 EST, followed by partial regional recovery at 23:36 EST. Our mail-related graphs remain disturbed beyond those milestones.
There is no contradiction: restoring some capacity or some regions does not mean every endpoint, tenant, or monitoring location recovers immediately.
Confidence: high that significant response-time instability persists in these checks; low confidence in attributing individual peaks to specific recovery actions.
Phase 4: Around 06:00–07:00 EST, November 13 — a major local recovery boundary
Both Outlook and SMTP return to a much quieter baseline.
This is the strongest recovery boundary visible in the collection.
It should be described as recovery of the measured responsiveness from our monitoring location, not universal restoration of Microsoft 365.
Backlogs, authenticated operations, and other regions could still have been affected.
Confidence: moderate-to-high, subject to checking the underlying samples and treatment of failed requests.
Phase 5: November 13 morning and afternoon — residual or separate portal disturbances
SharePoint, security, compliance, and administration endpoints show intermittent activity after the main mail-related disturbance subsides.
This could represent uneven recovery or separate transient problems. The graphs do not establish which.
Confidence: moderate that overlapping portal disturbances exist; low-to-moderate that they share one recovery-related cause.
Phase 6: November 14 onward — predominantly low measured response times
The available graphs generally show much quieter behavior, with occasional isolated spikes.
Some screenshots end earlier than others, so they do not all provide equal coverage of the later recovery period.
Low response time also cannot establish that all user-facing workflows or message backlogs had recovered.
Ai technical diagnosis Conclusion
The best-supported explanation: selective service-path impairment
The dataset is most consistent with a disruption that affected some service paths much more severely than others.
Mail-related endpoints exhibit the strongest and most sustained response-time abnormalities. Several portal endpoints remain relatively responsive, while identity endpoints do not show the same prolonged pattern.
That is a better fit for selective impairment in Microsoft-side service handling or shared dependencies than for a simple, continuous failure of our monitoring server’s internet connection.
A local or ISP-related problem cannot be excluded completely. Different endpoints can use different destinations and routes, and no non-Microsoft control graph is included.
Compatibility with the reported gateway explanation
The supplied synopsis describes networking gateway failures, reduced available capacity, traffic-allocation changes, and recovery complicated by incoming requests overwhelming recovering hosts.
Our observations are compatible with that account:
Observed behavior | Compatible explanation |
|---|---|
Frequent slow responses interspersed with faster ones | Requests encountering inconsistent capacity or different backend health |
Strong mail impact, lighter symptoms elsewhere | Different dependencies or different ability to route around affected infrastructure |
Extended instability despite partial recovery announcements | Restored capacity not yet sufficient or not benefiting every service path |
Approximately shared Outlook/SMTP recovery boundary | Recovery of a common dependency or a coordinated traffic/capacity change |
However, compatibility is not proof. External response-time graphs cannot identify gateway fleet health, capacity reductions, retry amplification, or the exact traffic-routing changes inside Microsoft.
The repeated 2.5-second peaks deserve investigation
Several portals show recurring peaks near a similar response-time value, approximately 2.5 seconds.
A repeated delay of similar magnitude can indicate a timer-driven mechanism—for example, an initial connection attempt failing before a retry or fallback succeeds.
But it could also result from monitoring configuration, aggregation, or ordinary endpoint behavior.
The correct next step would be to inspect transaction stages and check settings, not assume these peaks reveal a specific Microsoft timeout.
11. What these graphs cannot tell us
The most important limitation is that latency is not availability.
A check can return quickly because it received an error. A service can accept a connection while failing the next operation. A graph can look quiet if failed checks produce no response-time value.
These screenshots do not establish:
- Packet-loss rates.
- HTTP success or error rates.
- The number of timed-out checks.
- Whether missing measurements are connected by the graph.
- Whether displayed values are individual samples or time-bucket averages.
- Whether redirects are followed.
- Whether content is validated.
- Whether authenticated workflows succeed.
At least one screenshot shows the graph configured for Average. If time-bucket averaging is in use, short severe events may be understated. Conversely, lines drawn between successful samples can make intermittent observations look continuous.
The 10-second chart ceiling is another constraint. Values at the top of a graph may be near that value, exceed the visible range, or reflect a configured limit. The screenshots alone cannot resolve this.
Conclusion
The clearest story in these graphs is not that every Microsoft endpoint became slow at once.
It is that Outlook and SMTP entered a shared period of pronounced instability around noon EST on November 12, closely matching the reported incident onset. Both then returned to much quieter response-time behavior around 06:00–07:00 EST on November 13.
Other endpoints behaved differently. Authentication remained comparatively steady, administration portals showed intermittent variability, and several portals experienced a possible secondary disturbance during November 13.
My working diagnosis is a selective service-path disruption with uneven recovery, strongly affecting the measured mail endpoints rather than a uniform loss of access to Microsoft.
The broader monitoring lesson is straightforward:
A responsive Microsoft web endpoint is not proof of a healthy Microsoft 365 service. Measure latency, failures, and real transactions separately—and compare them across services and independent control destinations.
The November 12–14, 2026 Microsoft 365 Outage: What Our Monitoring Revealed
An EST timeline of endpoint latency, correlated mail-service disruption, and uneven recovery
During the recent November 12–14, 2026 Microsoft 365 outage, our internal monitoring server recorded response times for 11 Microsoft service and administration endpoints.
The strongest pattern appeared in the mail-related endpoints. Outlook and SMTP began showing pronounced instability around 12:00 p.m. EST on November 12, 2026, closely matching the reported start of Microsoft’s incident. Both returned to substantially quieter response-time behavior around 6:00–7:00 a.m. EST on November 13, 2026.
Other endpoints followed different patterns. Authentication remained comparatively steady, while several administration and governance portals showed intermittent disturbances, including a possible secondary cluster during the morning and afternoon of November 13.
Timezone note: All observations and incident milestones below are expressed in Eastern Standard Time (EST, UTC−5). Times estimated from screenshots are approximate. Reported Microsoft milestones come from the supplied incident synopsis and are distinguished from our monitoring observations.
Consolidated Incident Timeline — EST
Date and time — EST | Evidence | Technical interpretation |
|---|---|---|
November 11, 2026 — throughout the day | Several administration and governance endpoints already show isolated latency spikes. | Establishes pre-incident variability. Not every subsequent spike can be attributed to the outage. |
November 12, 2026 — morning, before approximately 12:00 p.m. | Intermittent activity appears across several endpoints; Outlook begins showing increased variability approaching noon. | Possible early degradation, but insufficient evidence to distinguish it from background variability. |
November 12, 2026 — approximately 12:00–1:00 p.m. | The reported incident-onset window overlaps the marked change in Outlook and SMTP response times. | Strongest onset correlation between our monitoring and the reported outage. |
November 12, 2026 — 12:54 p.m. | The supplied synopsis reports Microsoft acknowledging Exchange Online access problems in the Americas. | External acknowledgment follows closely after the apparent beginning of the main mail-endpoint disturbance. |
November 12, 2026 — 1:07 p.m. | The synopsis reports acknowledgment of broader global problems. | Consistent with an incident extending beyond a single endpoint or customer environment. |
November 12, 2026 — afternoon and evening | SMTP repeatedly records multi-second responses; Outlook shows repeated large excursions, approaching nine seconds. | Persistent, unstable mail-endpoint responsiveness rather than an isolated latency spike. |
November 12, 2026 — 6:04 p.m. | The synopsis reports some affected servers returning to service. | Our mail-related graphs remain disturbed afterward; partial infrastructure recovery did not immediately restore the measured experience. |
November 12, 2026 — 11:36 p.m. | The synopsis reports partial recovery in some regions. | Continued instability at our monitoring location remains compatible with regional or service-specific recovery. |
November 13, 2026 — approximately 6:00–7:00 a.m. | Both Outlook and SMTP return to much quieter response-time behavior. | Strongest shared recovery boundary visible in our measurements. This is not proof of global restoration or cleared mail queues. |
November 13, 2026 — approximately 9:00–11:00 a.m. | SharePoint shows a short cluster of elevated response times. Other portals show activity in the broader morning period. | Possible residual or secondary disturbance after the main mail-endpoint improvement. Exact synchronization requires raw samples. |
November 13, 2026 — morning through afternoon | Security, compliance, Teams administration, and the main administration portal show intermittent disturbances. | Supports an uneven recovery picture, although unrelated transient events remain possible. |
November 13, 2026 — approximately 4:00 p.m. | The sign-in endpoint shows an isolated response-time spike near five seconds. | A later isolated event—not evidence of a sustained authentication outage. |
November 14, 2026 — available observation periods | Most displayed endpoints show predominantly low response times, with occasional spikes. | Consistent with stabilization of the measured checks. Functional recovery cannot be established from latency alone. |
November 14, 2026 — morning, exact time unspecified | The supplied synopsis places full service restoration by this point, without a precise timestamp or clearly specified timezone. | Keep this milestone approximate; do not assign an invented EST restoration time. |
Hope you enjoyed this different take and analysis on one of the worst 365 outages Microsoft has had to date with its 365 services! Until next time.
God Bless
Dan